Series tutorial address: https://docs.whuanle.cn/
Developing .NET Diagnostic Tools
System.Diagnostics, Microsoft.Diagnostics
The interfaces in the System.Diagnostics and Microsoft.Diagnostics namespaces are used to diagnose .NET programs. They involve many diagnostic technologies. Due to personal technical limitations and space constraints, the author will only introduce several commonly used diagnostic methods without going deep into the underlying principles.
Debug, Trace
In the System.Diagnostics namespace there are two types, Debug and Trace, used to track code execution. Debug and Trace can print debugging information and use breakpoints to check logic, making code more reliable without affecting the performance of the released program. System.Diagnostics.Debug only works in the Debug environment and becomes ineffective in the Release environment. Apart from that, the interfaces of the two are almost identical.
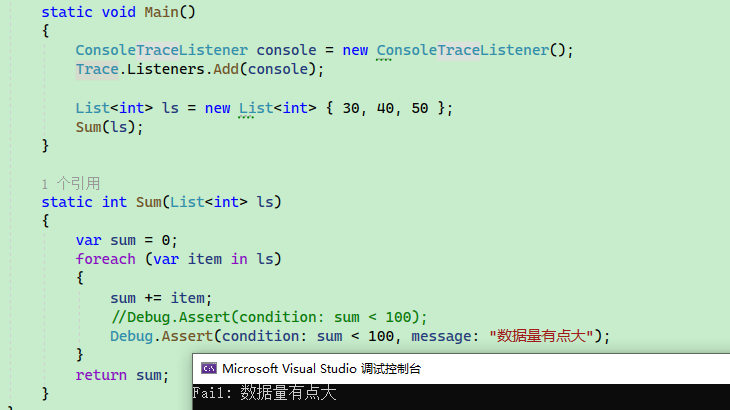
In the following example code, when the value of sum is within 100 the program runs normally. When the value of sum is greater than or equal to 100, a breakpoint is triggered and the IDE jumps to that location, which draws our attention.
static void Main()
{
	List<int> ls = new List<int> { 30, 40, 50 };
	Sum(ls);
}

static int Sum(List<int> ls)
{
	var sum = 0;
	foreach (var item in ls)
	{
		sum += item;
		// Triggered when the condition is false
		// Debug.Assert(condition: sum < 100);
		Debug.Assert(condition: sum < 100, message: "The data volume is a bit large");
	}
	return sum;
}
.Assert() triggers a breakpoint and prints information at the same time. The .NET Runtime source code makes extensive use of Debug.Assert(). The author also frequently uses Debug.Assert in projects. For example, a certain branch condition may rarely execute, and if that branch runs, it should draw the developer’s attention. On the one hand, Debug is only effective in debug mode and will not interfere with the running of released projects. IDE breakpoints only take effect on the current device environment and cannot share breakpoint positions with other devices, while Debug exists in the code and can be used by everyone.
In addition, Debug and Trace can print information through methods such as Write, WriteLine, WriteIf, WriteLineIf, Print, etc. By default the output is printed to the IDE debug output.
int value = -1;
Debug.Assert(value != -1, "The value should not be -1.");
Debug.WriteLineIf(value == -1, "The current value is unexpectedly -1.");
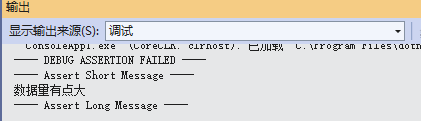
---- DEBUG ASSERTION FAILED ----
---- Assert Short Message ----
The value should not be -1.
---- Assert Long Message ----

   at Demo2.Diagnostics.Program.Main(String[] args) in E:\demo\Program.cs:line 14
The current value is unexpectedly -1.
You can also print information to the console or to files through listeners. If you want to print debug information to the console, you can register the corresponding listener:
Trace.Listeners.Add(new ConsoleTraceListener();
// or Trace.Listeners.Add(new TextWriterTraceListener(Console.Out));
Note: Debug does not have the Listeners property because Debug uses the listeners of Trace. After configuring Trace, Debug will also take effect.
The main listeners in .NET include DefaultTraceListener, TextWriterTraceListener, ConsoleTraceListener, DelimitedListTraceListener, EventLogTraceListener, etc.
If you need to output to a file, you can inherit TextWriterTraceListener and implement file stream output yourself, or use DelimitedListTraceListener.
Example:
// TraceListener listener = new TextWriterTraceListener(new FileStream(@"C:\debugfile.txt", FileMode.OpenOrCreate));
TraceListener listener = new DelimitedListTraceListener(@"D:\debugfile.txt");

Debug.Listeners.Add(listener);
Debug.WriteLine("Print debug information");
To format the output stream, you can use related properties to control layout:
| Property | Description |
| ----------- | ------------------------------------------------------------ |
| AutoFlush | Gets or sets a value indicating whether Listeners should call Flush() after each write. |
| IndentLevel | Gets or sets the indentation level. |
| IndentSize | Gets or sets the number of spaces used for indentation. |
Debug.WriteLine("One");
// Indent
Debug.Indent();
Debug.WriteLine("Two");
Debug.WriteLine("Three");
// End indentation
Debug.Unindent();

Debug.WriteLine("Four");
One
    Two
    Three
Four
EventSource, EventListener
In the System.Diagnostics.Tracing namespace, EventSource and DiagnosticCounter are abstract classes. EventSource is called an event source and is used to define events and record logs. The runtime itself contains many events, such as GC collection events and thread exit events, which can be monitored and analyzed with tools. DiagnosticCounter is called a counter and is used to collect various types of performance metrics, such as memory usage and GC trigger counts.
From a technical perspective, we need to focus on two parts: defining custom EventSource and DiagnosticCounter, and how to listen to EventSource and DiagnosticCounter.
Custom EventSource, DiagnosticCounter
We can define custom event sources in a program and then collect these events through code listeners or .NET diagnostic tools.
The example project is in Demo2.ES. The following code defines an event source class MyEventSource, which internally uses a counter. Its functionality is very simple: each loop triggers the counter inside MyEventSource to automatically increment by 1.
internal class Program
{
	private static readonly MyEventSource EventSource = new MyEventSource();
	public static void Main(string[] args)
	{
		int number = 0;
		while (true)
		{
			number++;
			EventSource.LogEvent("Test", number);
			Thread.Sleep(1000);
		}
	}
}

// MyEvent is the event name
[EventSource(Name = "MyEvent")]
public class MyEventSource : EventSource
{
	// Counter
	private readonly IncrementingEventCounter _incrementingEventCounter;
	public MyEventSource()
	{
		_incrementingEventCounter = new IncrementingEventCounter("MyEvent", this);
	}

	[Event(eventId: 1)]
	public void LogEvent(string message, int favoriteNumber)
	{
		_incrementingEventCounter.Increment();
		WriteEvent(1, message, favoriteNumber);
	}
}
Then we collect event information using the dotnet-trace tool.
Open a command line in an empty directory and execute the following command.
Install the dotnet-trace tool:
dotnet tool install -g dotnet-trace
List the .NET programs in the system and their process IDs:
$> dotnet-trace ps
18064  Demo2.ES ...
Collect events in process 18064 and specify the event provider name MyEvent:
dotnet-trace collect --process-id 18064 --providers MyEvent
After some time, press Enter or Ctrl+C. A .nettrace file will appear in the directory. Open the .nettrace file using Visual Studio.
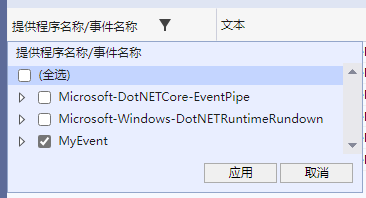
Then click the icon to the right of the table header “Provider Name/Event Name” and select MyEvent to filter events.
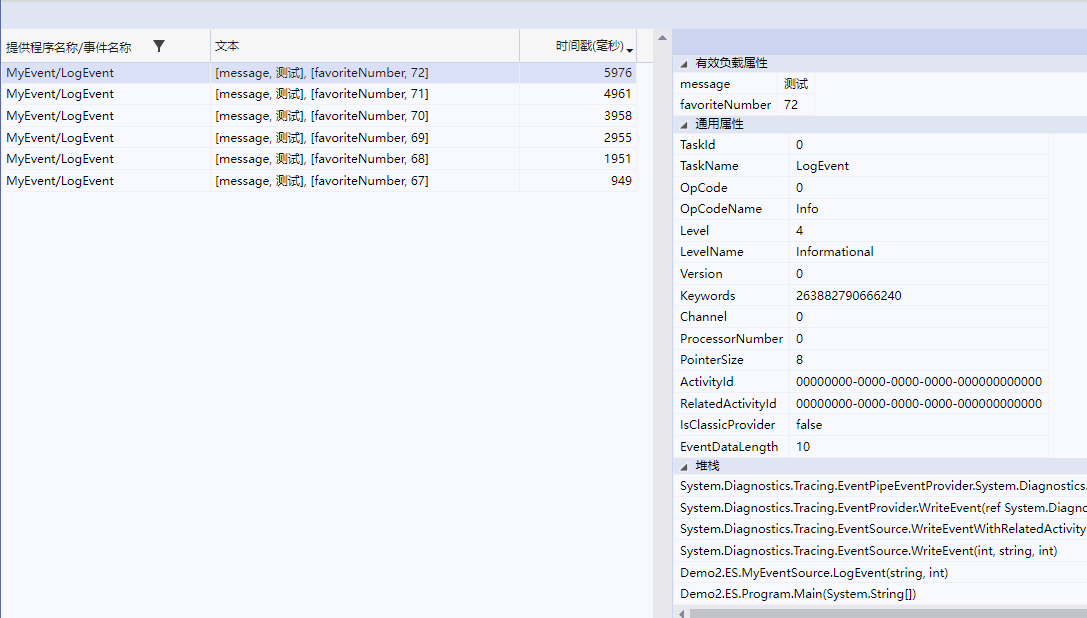
Then click a specific event to observe its information. The Text column shows the event information recorded using WriteEvent(1, message, favoriteNumber);. The Timestamp column records the time when the event occurred, and the property panel on the right shows detailed information about the event.
To define a custom event source you need to inherit EventSource. EventSource contains many functions for recording events, such as the WriteEvent method. Then the dotnet-trace tool can capture events occurring in the program and obtain the recorded event information.
Since we added a counter in the custom event source, we can also use the dotnet-counters tool to collect counter information.
dotnet-counters monitor --process-id 18064 --counters MyEvent
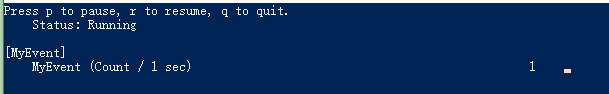
As shown in the figure above, dotnet-counters counts how many times the MyEvent counter is triggered within one second.
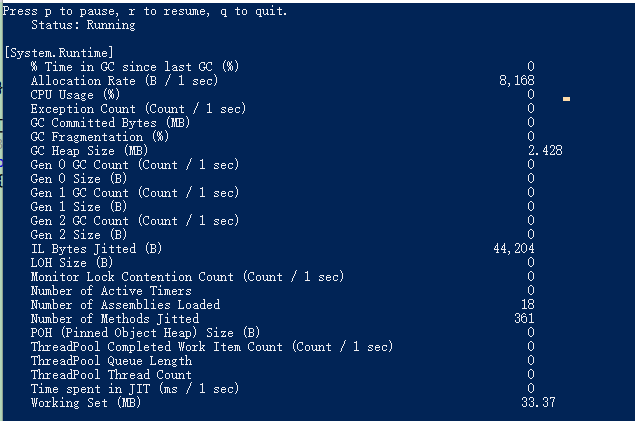
Of course, if no counter name is specified, dotnet-counters can display a lot of information in the CLR. In ASP.NET Core it can display request rate, concurrency, and so on.
dotnet-counters monitor --process-id 18064
We can also set some properties for the counter:
_incrementingEventCounter = new IncrementingEventCounter("MyEvent", this)
{
	// The following two can only be passed through the constructor
	// EventSource = this,
	// Name = "MyEvent"

	// Display name
	DisplayName = "MyEvent",
	// Time interval
	DisplayRateTimeScale = TimeSpan.FromSeconds(1),
	// Unit name
	DisplayUnits = "count"
};
In addition to IncrementingEventCounter, there are other types of counters:
- EventCounter: event counter
- IncrementingEventCounter: incrementing event counter
- PollingCounter: polling counter
- IncrementingPollingCounter: incrementing polling counter
From the examples above we can see that the information collected by dotnet-trace and dotnet-counters is based on EventSource and EventCounter. The .NET CLI diagnostic tools collect information through built-in or custom events and counters in .NET.
In .NET there are also some built-in event sources, including events for the thread pool, type system, exceptions, runtime methods, etc. For example, the .NET Runtime mainly provides the following two events:
Microsoft-Windows-DotNETRuntimeprovides various runtime events such as GC, JIT, exceptions, etc.Microsoft-DotNETCore-SampleProfilerprovides snapshots of managed thread stacks.
.NET also has other built-in events. Interested readers can learn more through the official documentation, which will not be repeated here.
Writing a collector
In the previous section we used the dotnet-trace and dotnet-counters tools to capture events and counters in the program. In this section, the author will introduce how to use EventListener to capture events occurring inside the program.
In the System.Net.Http package there are interfaces related to HTTP requests, such as HttpClient. System.Net.Http also has some built-in events to record HTTP request information. Some HTTP events are listed below:
| Event Name | Description |
| :-------------------- | :---------------- |
| RequestStart | The HTTP request has started. |
| RequestStop | The HTTP request has completed. |
| RequestFailed | The HTTP request failed. |
| ConnectionEstablished | The HTTP connection has been established. |
| ConnectionClosed | The HTTP connection has been closed. |
Now we will write an HttpClient program and then create a listener that listens to all HTTP requests emitted by the program and records the status codes.
The sample code is in Demo2.ESTrace.
public static class Program
{
	public static async Task Main(string[] args)
	{
		// Automatically called by the CLR
		HttpClientEventListener listener = new();

		Console.WriteLine("ActivityID ---- EventName ---- RequestAddress ---- Protocol");
		while (true)
		{
			await GetAsync();
			await Task.Delay(1000);
		}
	}

	static async Task GetAsync()
	{
		await new HttpClient().GetAsync("https://www.baidu.com");
	}
}

// Listener that only listens to the System.Net.Http event source
sealed class HttpClientEventListener : EventListener
{
	protected override void OnEventSourceCreated(EventSource eventSource)
	{
		switch (eventSource.Name)
		{
			case "System.Net.Http":
				EnableEvents(eventSource, EventLevel.Informational, EventKeywords.All);
				break;
		}

		base.OnEventSourceCreated(eventSource);
	}

	protected override void OnEventWritten(EventWrittenEventArgs eventData)
	{
		// RequestStart event
		if (eventData.EventId == 1)
		{
			var scheme = (string)eventData.Payload[0];
			var host = (string)eventData.Payload[1];
			var port = (int)eventData.Payload[2];
			var pathAndQuery = (string)eventData.Payload[3];
			var versionMajor = (byte)eventData.Payload[4];
			var versionMinor = (byte)eventData.Payload[5];
			var policy = (HttpVersionPolicy)eventData.Payload[6];

			Console.WriteLine($"{eventData.ActivityId} {eventData.EventName} {scheme}://{host}:{port}{pathAndQuery} HTTP/{versionMajor}.{versionMinor}");
		}
		}
		// RequestStop event
		else if (eventData.EventId == 2)
		{
			Console.WriteLine($"{eventData.ActivityId} {eventData.EventName} StatusCode: {eventData.Payload[0]}");
		}
	}
}
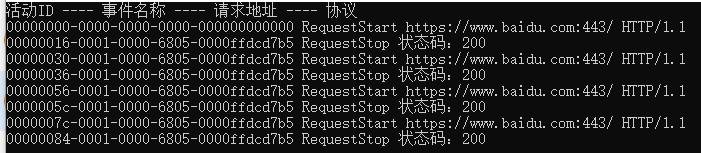
After running, event information can be seen in the console.
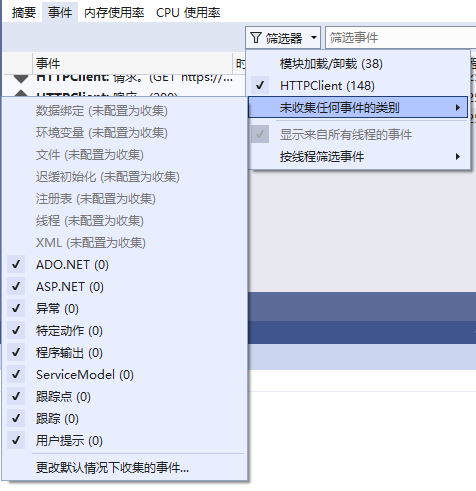
In addition, the related events can also be viewed through Visual Studio diagnostic tools, or collected using the dotnet-trace tool.
However, the listener currently used can only collect events within its own process. In the earlier examples, dotnet-trace and dotnet-counters were able to collect information across processes. How do they achieve cross-process collection? Next we will learn how to write a cross-process diagnostic tool that collects information.
。
Writing Diagnostic Tools
There are many dotnet CLI tools. In addition to the previously mentioned dotnet-trace and dotnet-counters, there are also CLI tools such as dotnet-dump and dotnet-gcdump. These tools can collect program information through cross-process mechanisms. In this section, we will use the diagnostics toolkit to collect information across processes and implement a similar tool.
Write a simple console program and start it:
private static readonly HttpClient Http = new();
public static async Task Main(string[] args)
{
	while (true)
	{
		await Http.GetAsync("https://www.baidu.com");
		await Task.Delay(1000);
		GC.Collect();
	}
}
Then write a diagnostic tool. The sample project is in Demo2.Diagnostics.
Create a console application and add two packages:
  <ItemGroup>
    <PackageReference Include="Microsoft.Diagnostics.NETCore.Client" Version="0.2.442301" />
    <PackageReference Include="Microsoft.Diagnostics.Tracing.TraceEvent" Version="3.1.5" />
  </ItemGroup>
Write a program that subscribes to event information:
internal class Program
{
	static void Main(string[] args)
	{
		// Get all .NET processes
		var processes = DiagnosticsClient.GetPublishedProcesses()
			.Select(Process.GetProcessById)
			.Where(process => process != null);
		Console.WriteLine("Please enter the process id");
		foreach (var item in processes)
		{
			Console.WriteLine($"{item.Id} ------ {item.ProcessName}");
		}

		var read = Console.ReadLine();
		ArgumentNullException.ThrowIfNullOrEmpty(read);
		var pid = int.Parse(read);

		var providers = new List<EventPipeProvider>()
			{
				new ("Microsoft-Windows-DotNETRuntime", EventLevel.Informational, (long)ClrTraceEventParser.Keywords.GC),
			};

		var client = new DiagnosticsClient(pid);

		using var session = client.StartEventPipeSession(providers: providers, requestRundown: false, circularBufferMB: 256);
		var source = new EventPipeEventSource(session.EventStream);

		// CLR events
		source.Clr.All += (TraceEvent obj) =>
		{
			Console.WriteLine(obj.ToString());
		};

		// Subscribe to all events listened to in providers
		// If you want to subscribe to all events, you should use Dynamic.All
		//source.AllEvents += (TraceEvent obj) =>
		//{
		//    Console.WriteLine(obj.ToString());
		//};

		// Kernel events
		//source.Kernel.All += (TraceEvent obj) =>
		//{
		//    Console.WriteLine(obj.ToString());
		//};

		// Dynamically handle all events
		//source.Dynamic.All += (TraceEvent obj) =>
		//{
		//    Console.WriteLine(obj.ToString());
		//};

		// Usually used under Debug
		// When an event is not subscribed and handled, this handler will be used
		//source.UnhandledEvents += (TraceEvent obj) =>
		//{
		//    Console.WriteLine(obj.ToString());
		//};


		try
		{
			// Listen to the process
			source.Process();
		}
		catch (Exception e)
		{
			Console.WriteLine(e.ToString());
		}
	}
}
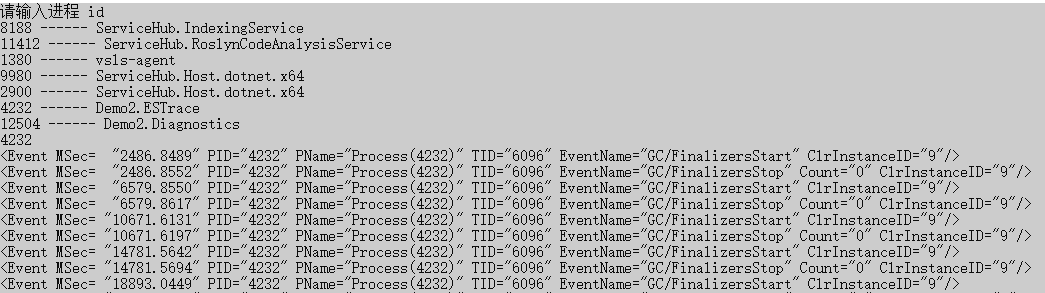
Then start Demo2.Diagnostics and enter the process ID of the console application. You will then be able to observe the GC events of the monitored process.
We can also create a tool similar to dotnet-dump to capture process snapshots.
static async Task Main()
{
	var processes = DiagnosticsClient.GetPublishedProcesses()
	.Select(Process.GetProcessById)
	.Where(process => process != null);
	Console.WriteLine("Please enter the process id");
	foreach (var item in processes)
	{
		Console.WriteLine($"{item.Id} ------ {item.ProcessName}");
	}

	var read = Console.ReadLine();
	ArgumentNullException.ThrowIfNullOrEmpty(read);
	var pid = int.Parse(read);

	var client = new DiagnosticsClient(pid);
	await client.WriteDumpAsync(
		dumpType: DumpType.Full,
		dumpPath: $"D:/{pid}_{DateTime.Now.Ticks}.dmp",
		logDumpGeneration: true,
		token: CancellationToken.None
	);
}
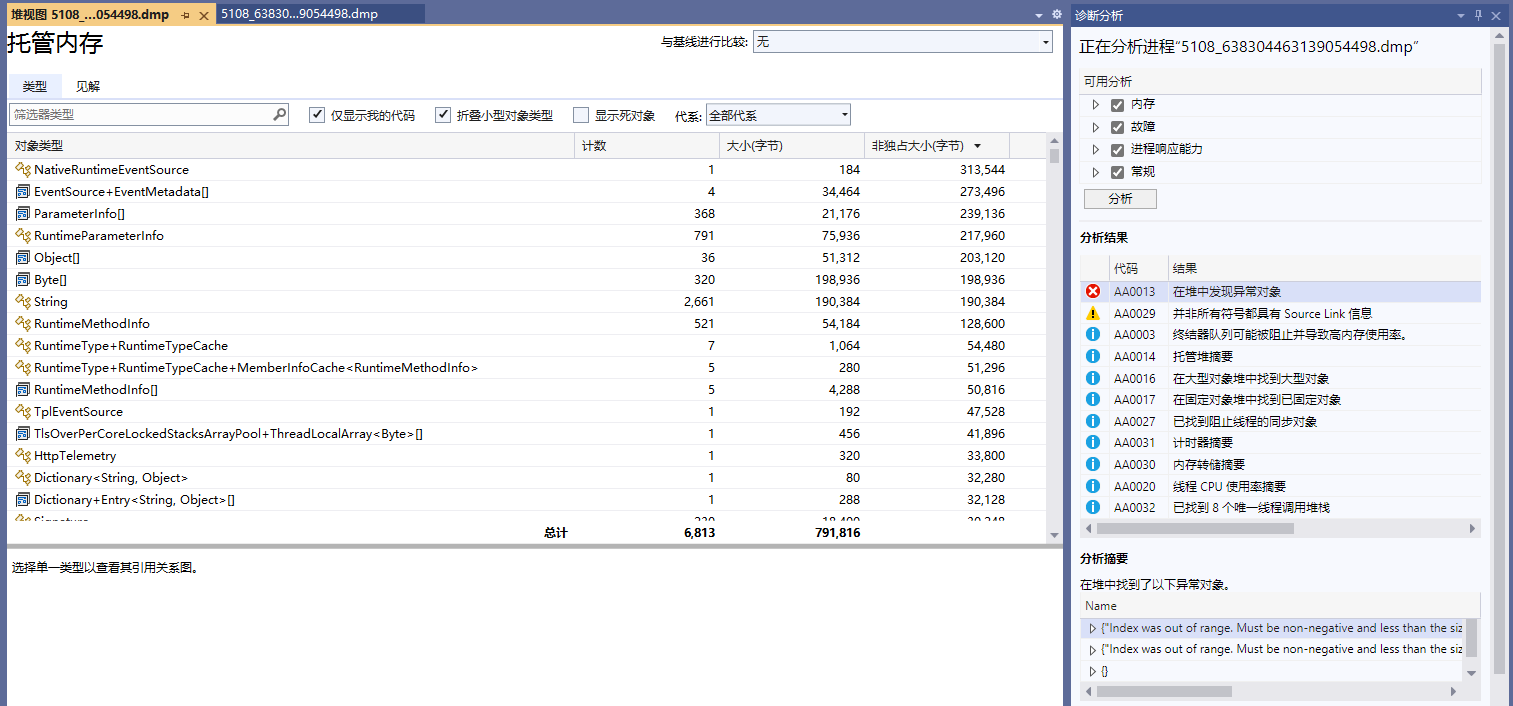
Then open the .dmp file using Visual Studio, and you can see a lot of snapshot information.
We have already introduced the interfaces in System.Diagnostics and demonstrated the usage of some .NET CLI tools. Therefore, diagnostic tools such as dotnet-gcdump and dotnet-dump will not be introduced separately. Readers can refer to the official documentation as needed.
https://learn.microsoft.com/en-us/dotnet/core/diagnostics/microsoft-diagnostics-netcore-client
Currently, many observability frameworks written in C# are based on System.Diagnostics and Microsoft.Diagnostics. Since this book does not involve microservices, the principles of such frameworks in C# programs will not be elaborated here. Please refer to the official documentation.
You can also refer to another MQ project by the author: https://mmq.whuanle.cn/7.opentelemetry.html

文章评论