Maomi framework address
https://docs.whuanle.cn/zh/maomi
Learning tutorial for developing a .NET framework:
https://docs.whuanle.cn/zh/maomi_framework
Troubleshooting and Logging
There are many ways to troubleshoot a .NET application. Based on personal experience, the author commonly summarizes the following approaches:
IDE debugging, diagnostic tools in Visual Studio, and performance profilers
Generally speaking, using an IDE for breakpoint debugging and diagnostics is only suitable in a local development environment. We can use the tools in the IDE for breakpoint debugging and to collect detailed runtime information about the program. The IDE is the most complete and effective tool for diagnosing program issues.
.NET CLI tools such as dotnet-dump, dotnet-trace, etc.
.NET CLI tools themselves are implemented based on interfaces in System.Diagnostics and Microsoft.Diagnostics. They can listen to and collect information from .NET processes across processes, such as memory snapshots.
Using interfaces in System.Diagnostics and Microsoft.Diagnostics
Newer versions of .NET use these interfaces for stack tracing, performance probing, and similar diagnostics. Many tools from Microsoft and the community use these interfaces, such as prometheus-net and opentelemetry-dotnet. In microservice scenarios, these interfaces provide a large amount of useful information that can be integrated into observability platforms.
Printing logs
Logging is the most commonly used and indispensable method for troubleshooting programs, and it is also the simplest. Logs produced by a program can provide useful information for troubleshooting. At the same time, observing logs helps monitor the running state of the program, and logs can also record audit information for later tracing.
However, in many years of development work, the author has found that most developers rarely write logs, and the logs they do write are almost useless for diagnosing issues. This is because such logs often just wrap code with try-catch{} and directly print exceptions, or simply print API request and response content. Logging is extremely helpful for troubleshooting, yet developers often do not value it or only log minimal information.
Infrastructure observability platforms and client packages such as prometheus-net
For production environments, architectural considerations are necessary, and different technologies should be adopted depending on the runtime environment, such as bare metal, docker, Kubernetes, cloud functions, etc.
Taking a Kubernetes cluster environment as an example: with the development of microservices and the maturity of existing professional monitoring platforms, it becomes necessary to monitor the program's runtime state from the infrastructure level, reducing code-level intrusion into the application.
We can use Fluentd, Logstash, and similar tools to collect container logs, use Elasticsearch to aggregate and store logs, and then use Kibana for visualized log queries. This technology of observing program runtime state using tools external to the program is called observability technology.
Currently, in the field of observability, there are three major categories: Tracing, Logging, and Metrics. These technologies are more related to architecture and operations, so they will only be briefly introduced in the last section of this chapter.
We often encounter situations where everything works perfectly in development and testing environments, but unexpected issues appear after the project goes online. For example, poor interface performance or code execution order that does not meet expectations.
Troubleshooting in production environments is more difficult. Development tools cannot be directly used for debugging in production, and troubleshooting cannot negatively impact user experience. Therefore, developers must reserve sufficient information in logs, or use various monitoring tools to collect runtime information. At the same time, developers need to master multiple diagnostic tools.
From the perspective of program diagnostics, different tools and methods exist depending on whether the view is from development, architecture, or operations. This chapter focuses on the developer's perspective and introduces some technologies that should be considered when designing or customizing enterprise internal development frameworks.
Logging
Using runtime logs in programs is the simplest, most common, and most effective method. In this section, we will learn several approaches for writing logs in programs and how to customize commonly used logging frameworks.
Logging Abstraction Interfaces
.NET abstracts logging interfaces through Microsoft.Extensions.Logging.Abstractions. Most popular logging frameworks currently implement the corresponding interfaces based on this abstraction package, allowing us to use abstract logging interfaces in projects without caring which logging framework is actually used.
.NET officially implements these abstractions using Microsoft.Extensions.Logging, and there are also community frameworks such as Serilog. Since the Serilog framework provides very convenient extensions and flexible customization, this chapter will introduce the usage of the Serilog framework in detail.
Microsoft.Extensions.Logging.Abstractions has three main interfaces:
ILogger — used to output logs.
ILoggerFactory — obtains logging interfaces and stores logging providers.
ILoggerProvider — provides logging interfaces.
ILoggerFactory
Many standard interfaces in .NET Core follow the factory pattern. ILoggerFactory is the interface for the factory pattern, while LoggerFactory is its implementation.
Its definition is as follows:
public interface ILoggerFactory : IDisposable
{
    ILogger CreateLogger(string categoryName);
    void AddProvider(ILoggerProvider provider);
}
The purpose of the ILoggerFactory factory interface is to create instances of the ILogger type, namely through the CreateLogger interface.
Logging providers are called logging providers. Logging Providers display or store logs in specific media, such as the console, log files, Elasticsearch, etc.
Microsoft officially provides many logging packages:
- Microsoft.Extensions.Logging.Console
- Microsoft.Extensions.Logging.AzureAppServices
- Microsoft.Extensions.Logging.Debug
- Microsoft.Extensions.Logging.EventLog
- Microsoft.Extensions.Logging.EventSource
- Microsoft.Extensions.Logging.TraceSource
ILoggerProvider
By implementing the ILoggerProvider interface, you can create your own logging provider, such as for console or file logging. It represents a type that can create ILogger instances.
Its definition is as follows:
public interface ILoggerProvider : IDisposable
{
    ILogger CreateLogger(string categoryName);
}
ILogger
The ILogger interface provides methods for recording logs to underlying storage. Its definition is as follows:
public interface ILogger
{
    void Log<TState>(LogLevel logLevel,
                     EventId eventId,
                     TState state,
                     Exception exception,
                     Func<TState, Exception, string> formatter);

    bool IsEnabled(LogLevel logLevel);
    IDisposable BeginScope<TState>(TState state);
}
Although ILogger only has three interface methods, after adding logging libraries there will be many extension methods.
In summary, if you want to use a logging framework, you need to implement ILogger, ILoggerFactory, and ILoggerProvider.
The widely used Serilog framework in the community provides sinks such as File, Console, Elasticsearch, Debug, MSSqlServer, Email, and many extensions.
Log Levels
In the Logging API, seven log levels are defined as follows:
public enum LogLevel
{
  Debug = 1,
  Verbose = 2,
  Information = 3,
  Warning = 4,
  Error = 5,
  Critical = 6,
  None = int.MaxValue
}
We can output logs of the following levels through functions in ILogger:
logger.LogInformation("Logging information.");
logger.LogCritical("Logging critical information.");
logger.LogDebug("Logging debug information.");
logger.LogError("Logging error information.");
logger.LogTrace("Logging trace");
logger.LogWarning("Logging warning.");
In logging configuration files, we often see configurations like this:
    "MinimumLevel": {
      "Default": "Debug",
      "Override": {
        "Default": "Debug",
        "Microsoft": "Warning",
        "System": "Warning"
      }
The MinimumLevel property configures the minimum level required for logs to be printed. Logs below this level will not be output. Override allows custom restrictions for different namespaces.
For example, we may want detailed logs for business logic in the application, so the default level can be set to Debug. However, namespaces starting with System and Microsoft also produce a large amount of logs, which are usually not very useful. Therefore, we can set their level to Warning, so the logging system will only output logs at Warning level or above for namespaces beginning with System and Microsoft.
Of course, some libraries under System and Microsoft may output important logs, so we can configure output levels for specific namespaces individually:
      "Override": {
        "Default": "Debug",
        "Microsoft.AspNetCore.HttpLogging.HttpLoggingMiddleware": "Information",
        "Microsoft": "Warning",
        "System": "Warning"
      }
In ASP.NET Core, the following namespaces serve different purposes, and readers can configure minimum log levels for them individually.
| Category | Description |
| :------------------------------------ | :----------------------------------------------------------- |
| Microsoft.AspNetCore | General ASP.NET Core diagnostics. |
| Microsoft.AspNetCore.DataProtection | Which keys were considered, discovered, and used. |
| Microsoft.AspNetCore.HostFiltering | Allowed hosts. |
| Microsoft.AspNetCore.Hosting | HTTP request completion time and startup time. Which hosting startup assemblies were loaded. |
| Microsoft.AspNetCore.Mvc | MVC and Razor diagnostics. Model binding, filter execution, view compilation, and action selection. |
| Microsoft.AspNetCore.Routing | Routing match information. |
| Microsoft.AspNetCore.Server | Connection start, stop, and keep-alive responses. HTTP certificate information. |
| Microsoft.AspNetCore.StaticFiles | Files served. |
In the remaining sections of this chapter, the author will introduce how to implement a custom logging framework, how to use Serilog, and how to design diagnostic tools using .NET.
Custom Logging Framework
When studying this chapter, please use the learn branch.
https://github.com/whuanle/maomi/tree/learn
The example project in this section is in Demo2.MyLogger.Console.
After creating a console project, add a reference to Microsoft.Extensions.Logging.Console.
。
Create MyLoggerOptions to store logging configuration:
public class MyLoggerOptions
{
	/// <summary>
	/// Minimum log level
	/// </summary>
	public LogLevel DefaultLevel { get; set; } = LogLevel.Debug;
}
Create a custom logger:
/// <summary>
/// Custom logger
/// </summary>
public class MyConsoleLogger : ILogger
{
	// Log name
	private readonly string _name;
	private readonly MyLoggerOptions _options;

	public MyConsoleLogger(string name, MyLoggerOptions options)
	{
		_name = name;
		_options = options;
	}

	public IDisposable? BeginScope<TState>(TState state) where TState : notnull => default!;

	// Determine whether the log level is enabled
	public bool IsEnabled(LogLevel logLevel)
	{
		return logLevel >= _options.DefaultLevel;
	}

	// Record logs; formatter is a string formatter provided by the framework
	public void Log<TState>(
		LogLevel logLevel,
		EventId eventId,
		TState state,
		Exception? exception,
		Func<TState, Exception?, string> formatter)
	{
		if (!IsEnabled(logLevel))
		{
			return;
		}
		if (logLevel == LogLevel.Critical)
		{
			System.Console.ForegroundColor = System.ConsoleColor.Red;
			System.Console.WriteLine($"[{logLevel}] {_name} {formatter(state, exception)} {exception}");
			System.Console.ResetColor();
		}
		else if (logLevel == LogLevel.Error)
		{
			System.Console.ForegroundColor = System.ConsoleColor.DarkRed;
			System.Console.WriteLine($"[{logLevel}] {_name} {formatter(state, exception)} {exception}");
			System.Console.ResetColor();
		}
		else
		{
			System.Console.WriteLine($"[{logLevel}] {_name} {formatter(state, exception)} {exception}");
		}
	}
}
Create a custom logging provider:
[ProviderAlias("MyConsole")]
public sealed class MyLoggerProvider : ILoggerProvider
{
	private MyLoggerOptions _options;
	private readonly ConcurrentDictionary<string, MyConsoleLogger> _loggers =
		new(StringComparer.OrdinalIgnoreCase);

	public MyLoggerProvider(MyLoggerOptions options)
	{
		_options = options;
	}

	public ILogger CreateLogger(string categoryName) =>
		_loggers.GetOrAdd(categoryName, name => new MyConsoleLogger(name, _options));

	public void Dispose()
	{
		_loggers.Clear();
	}
}
Write an extension method to inject the custom logging provider:
public static class MyLoggerExtensions
{
	public static ILoggingBuilder AddMyConsoleLogger(
		this ILoggingBuilder builder, Action<MyLoggerOptions> action)
	{
		MyLoggerOptions options = new();
		if (action != null)
		{
			action.Invoke(options);
		}

		builder.AddConfiguration();
		builder.Services.TryAddEnumerable(
			ServiceDescriptor.Singleton<ILoggerProvider>(new MyLoggerProvider(options)));
		return builder;
	}
}
Finally, use LoggerFactory from Microsoft.Extensions.Logging to build a logging factory, generate ILogger objects from it, and print logs:
static void Main(string[] args)
{
using ILoggerFactory factory = LoggerFactory.Create(builder =>
{
builder.AddConsole();
builder.AddMyConsoleLogger(options =>
{
options.DefaultLevel = LogLevel.Debug;
});
});
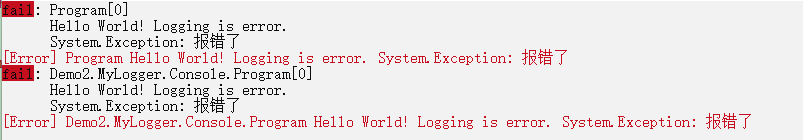
ILogger logger1 = factory.CreateLogger("Program");
ILogger logger2 = factory.CreateLogger<Program>();
logger1.LogError(new Exception("An error occurred"), message: "Hello World! Logging is {Description}.", args: "error");
logger2.LogError(new Exception("An error occurred"), message: "Hello World! Logging is {Description}.", args: "error");
}

文章评论