导读
CZGL.ProcessMetrics 是一个 Metrics 库,能够将程序的 GC、CPU、内存、机器网络、磁盘空间等信息记录下来,使用 Prometheus 采集信息,然后使用 Grafana 显示。
视频地址:
https://www.bilibili.com/video/BV18y4y1K7Ax/
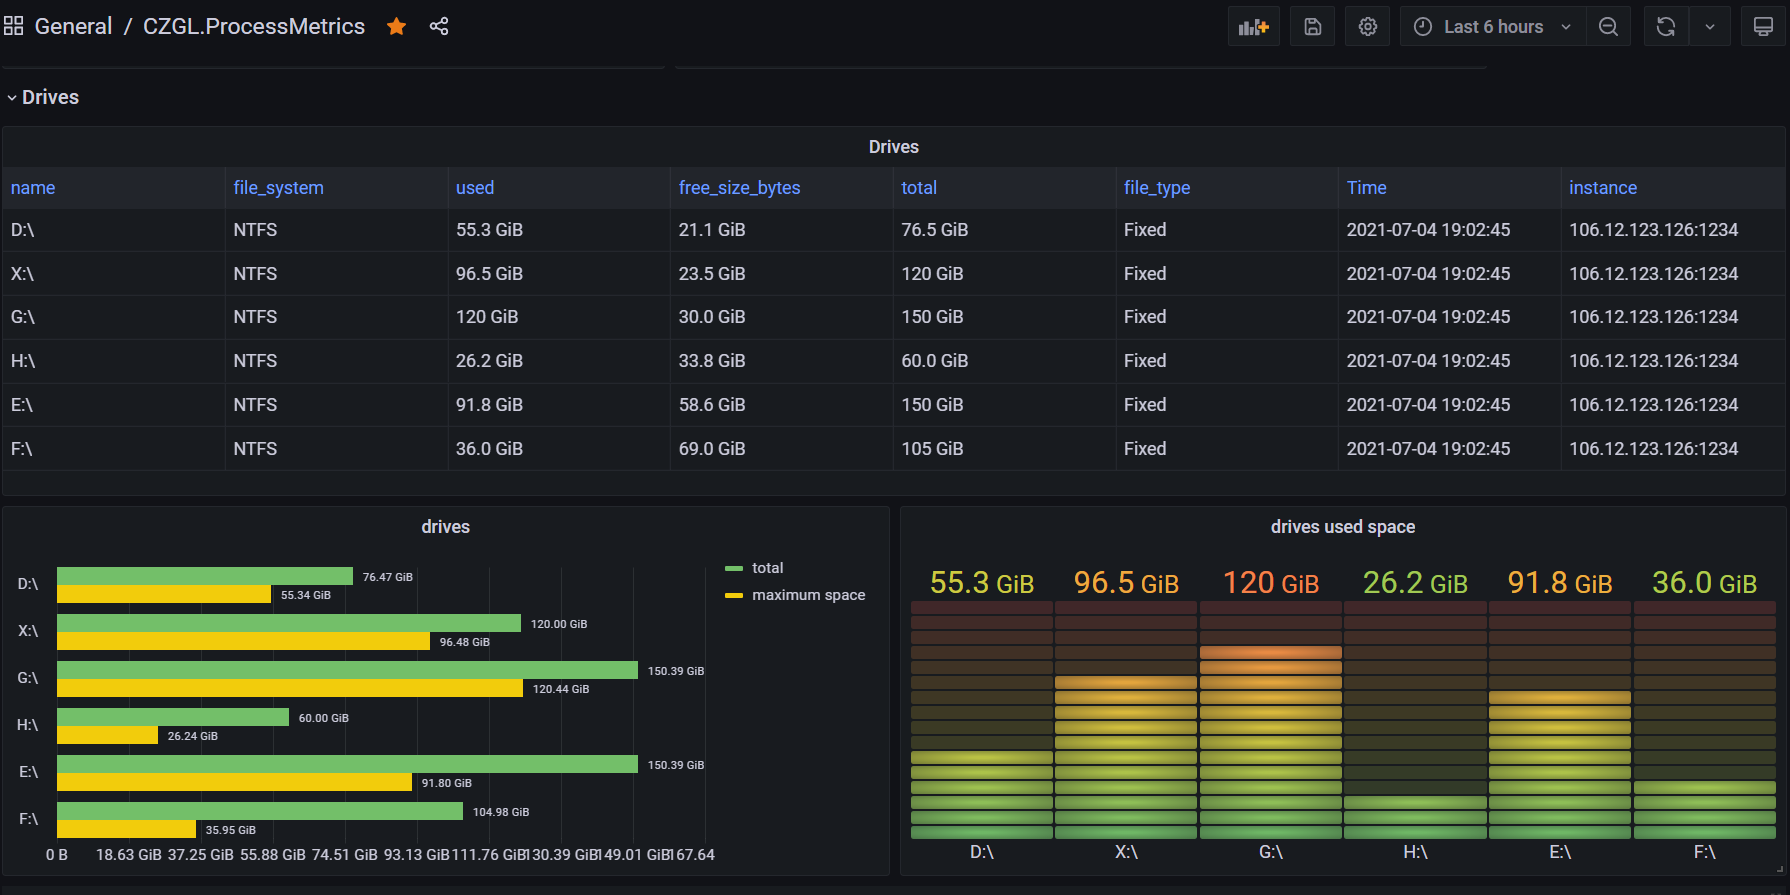
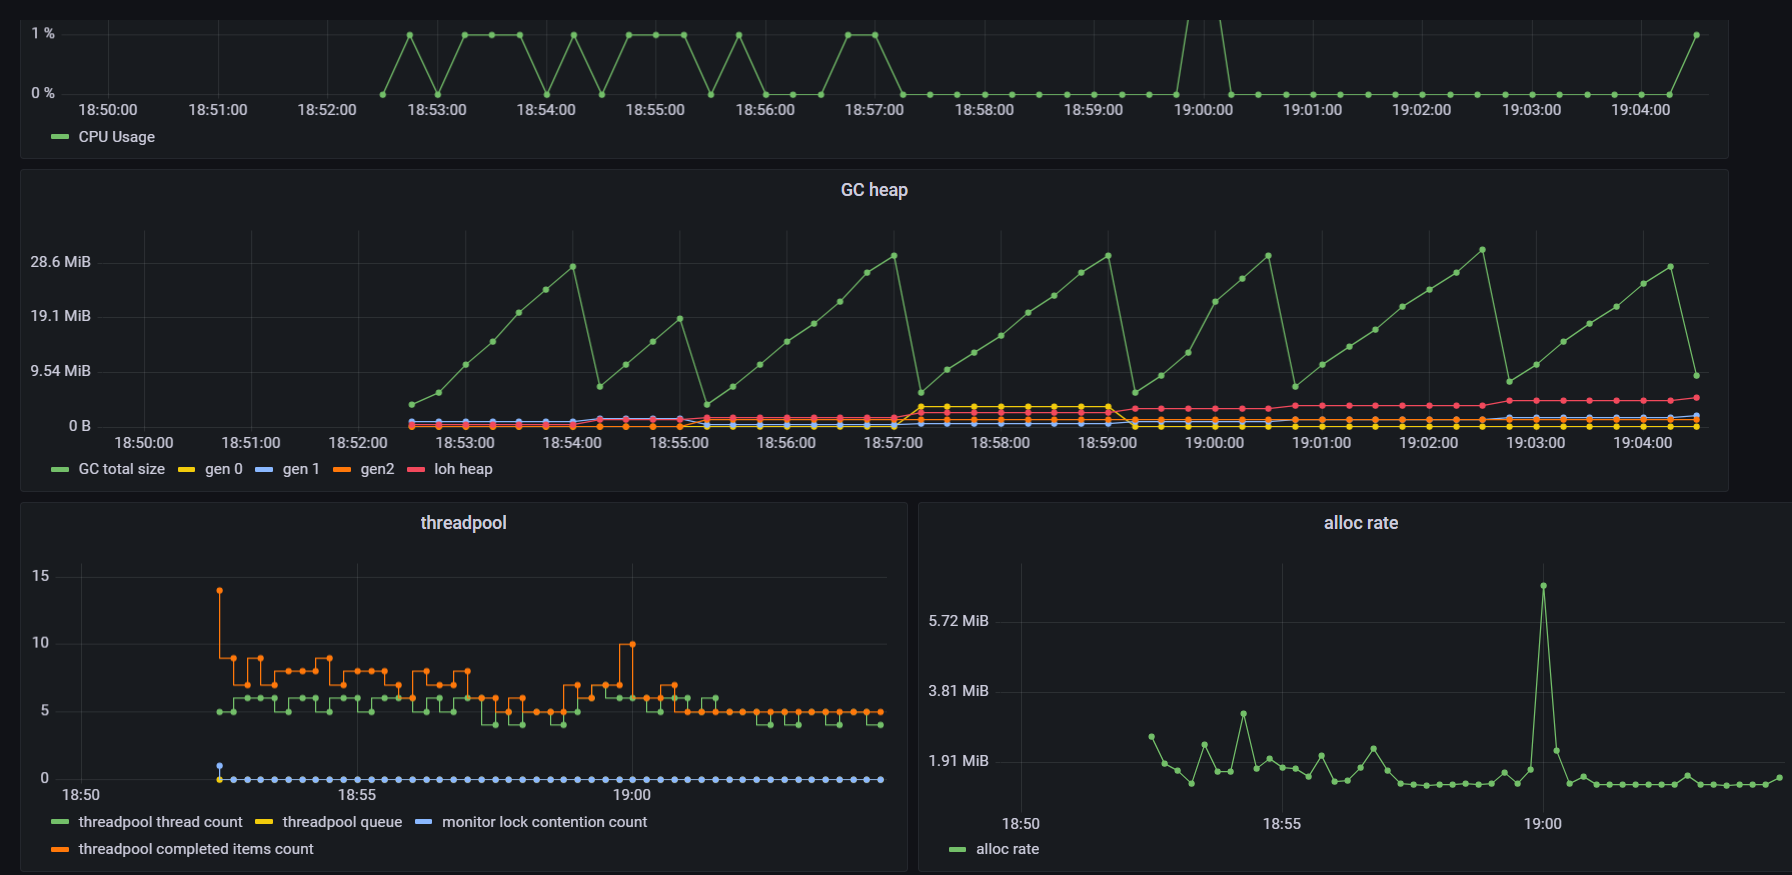
效果图预览:
安装 ProcsssMetrics
只需要通过 Nuget 安装一个库,即可快速为程序添加资源监视。
新建一个 ASP.NET Core 应用, Nuget 中搜索 CZGL.ProcessMetrics 直接引用即可。
Nuget 地址:https://www.nuget.org/packages/CZGL.ProcessMetrics
然后在中间件中,加上 ProcessMetrics 的访问服务。
            app.UseEndpoints(endpoints =>
            {
                endpoints.MapControllers();
                endpoints.ProcessMetrices("/metrics");
            });
访问相应的 URL,可以看到有很多信息输出,这些都是 Prometheus 数据的格式。
http://127.0.0.1:1234/metrics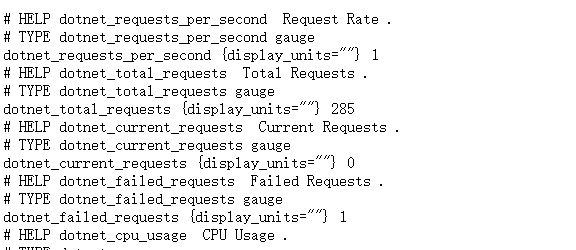
搭建 Prometheus/Grafana
这里我们使用 Docker 来搭建监控平台。
拉取镜像:
docker pull prom/prometheus
docker pull grafana/grafana
在 /opt/prometheus 目录下,新建一个 prometheus.yml 文件,其内容如下:
# my global config
global:
  scrape_interval:     15s # Set the scrape interval to every 15 seconds. Default is every 1 minute.
  evaluation_interval: 15s # Evaluate rules every 15 seconds. The default is every 1 minute.
  # scrape_timeout is set to the global default (10s).

# Alertmanager configuration
alerting:
  alertmanagers:
  - static_configs:
    - targets:
      # - alertmanager:9093

# Load rules once and periodically evaluate them according to the global 'evaluation_interval'.
rule_files:
  # - "first_rules.yml"
  # - "second_rules.yml"

# A scrape configuration containing exactly one endpoint to scrape:
# Here it's Prometheus itself.
scrape_configs:
  # The job name is added as a label `job=<job_name>` to any timeseries scraped from this config.
  - job_name: 'prometheus'

    # metrics_path defaults to '/metrics'
    # scheme defaults to 'http'.

    static_configs:
    - targets: ['localhost:9090']

  - job_name: 'processmetrice'
    metrics_path: '/metrics'
    static_configs:
    - targets: ['123.123.123.123:1234']
请替换最后一行的 IP。
使用容器启动 Prometheus:
docker run -d -p 9090:9090 -v /opt/prometheus/prometheus.yml:/etc/prometheus/prometheus.yml prom/prometheus使用容器启动 Grafana:
mkdir /opt/grafana-storage
chmod 777 -R /opt/grafana-storage
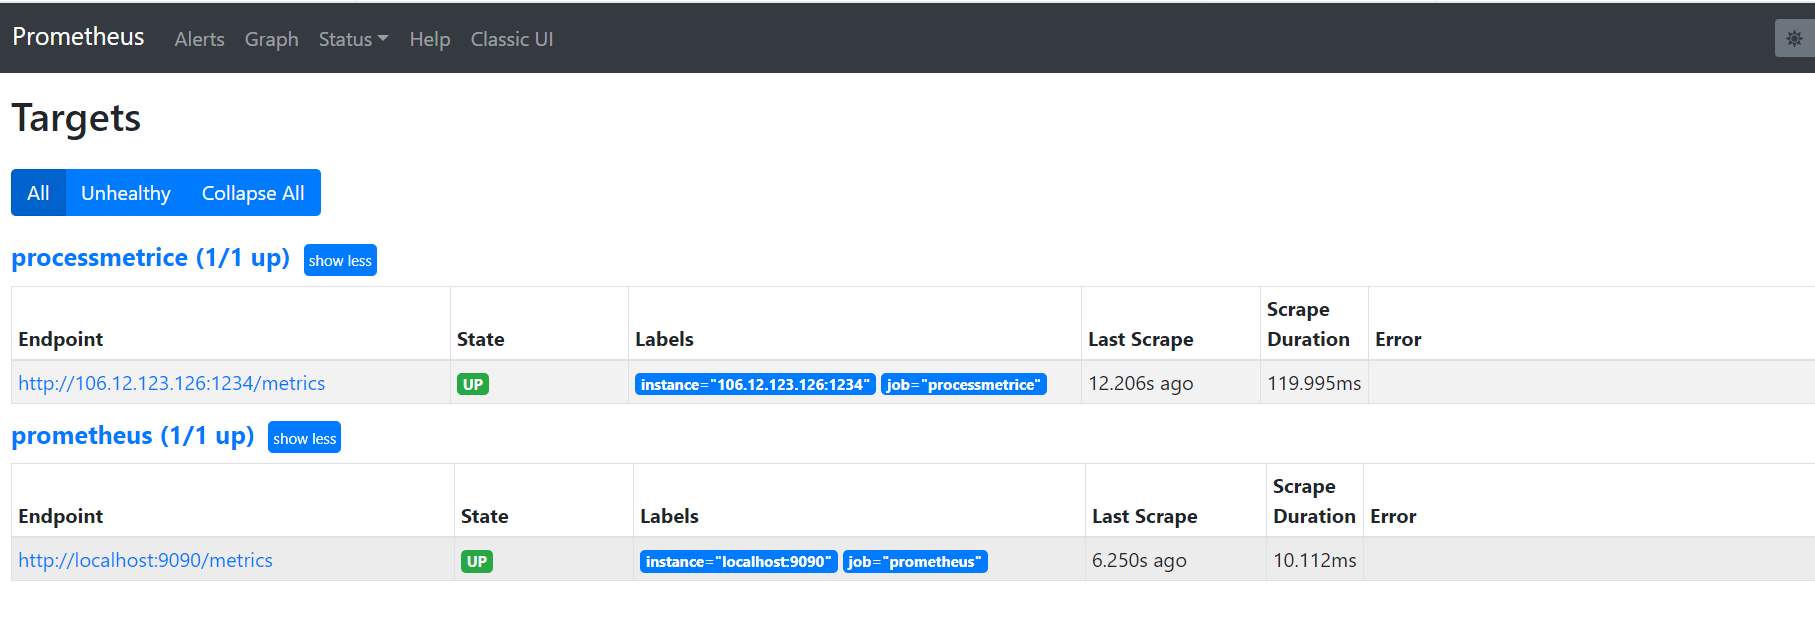
docker run -d -p 3000:3000 --name=grafana -v /opt/grafana-storage:/var/lib/grafana grafana/grafana打开 9090 端口,在菜单栏中打开 Status-Targets,可以看到有相关记录。
接着,访问 3000 端口,打开 Grafana,初始账号密码都是 admin 。
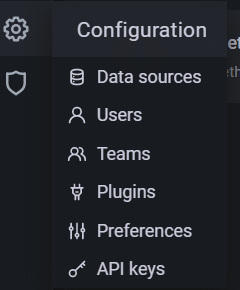
配置 Grafana
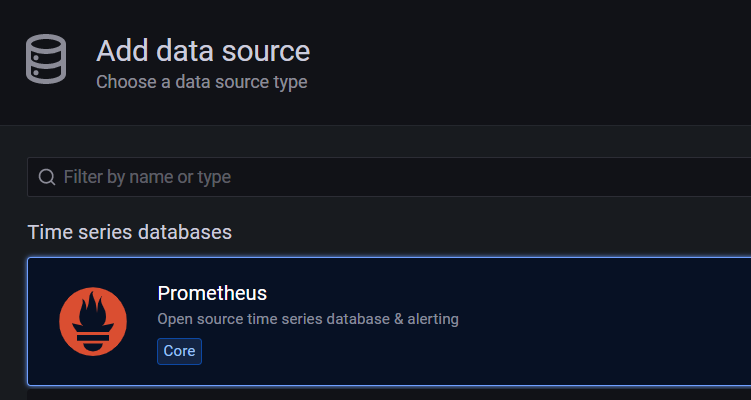
首先我们要为 Grafana 获取 Prometheus 中的监控数据,我们要添加一个数据源。
选择 Prometheus,按照提示,填写好 HTTP-URL 即可。
接着,下载笔者定制好的 Jsom Model,文件名为 CZGL.ProcessMetrics.json。
下载地址:
https://github.com/whuanle/CZGL.SystemInfo/releases/tag/v1.0
然后导入模型文件。
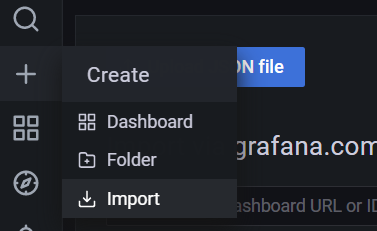
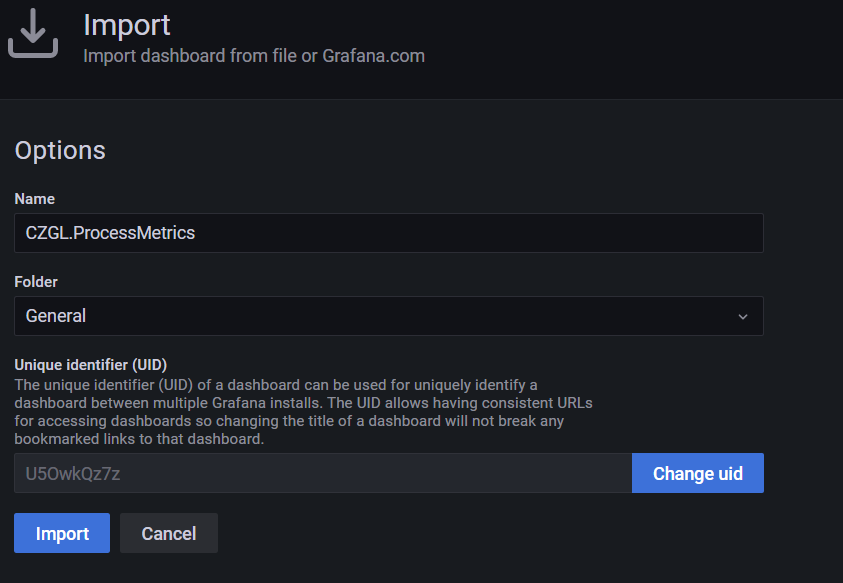
即可看到监控界面。

文章评论