Background
A 32G + 1T R7-8745H host has been set up at home to deploy various database services for daily development. As demands have increased, there is a need for observability components. Therefore, I am researching deployment solutions that are cost-effective, easy to use, and capable of high throughput for small and medium-sized companies.
The primary deployment environment for this question is Docker, without involving Kubernetes. However, the components discussed can be deployed in Kubernetes for distributed scaling and collecting cluster information as per actual needs.
For information on cluster deployment principles, please refer to the author's earlier articles:
Kubernetes Cluster Logging and EFK Architecture Logging Solution: https://www.cnblogs.com/whuanle/p/15893923.html
Design and Practice of Kubernetes Cluster and Application Monitoring Solutions: https://www.cnblogs.com/whuanle/p/15890343.html
Solution Description
There are numerous implementations for observability, such as the Grafana ecosystem and the Elastic commercial stack. While commercial options may incur costs, there are also integrated platforms like GreptimeDB that are open-source. To study the characteristics and deployment processes of various middleware services, we will not be using these integrated platforms, instead opting to deploy various open-source components.
The primary goal is to establish a low-cost solution for small enterprises, focusing on satisfying data storage and querying needs for log, trace, and monitoring data for more than 10 days with minimal memory usage.
The main approach involves separating the research into Logs, Traces, and Metrics.
Let us understand the three key components of logging.
Logging Agent: A logging agent that runs on server nodes to collect system logs, service logs, Docker container logs, Kubernetes service logs, etc. It continuously centralizes these logs to the logging backend.
Logging Backend: A centralized system that can store, search, and analyze log data.
Log Visualization: Tools that visualize log data in the form of dashboards.
First, for the Logging Agent, the most commonly used community component is Logstash, which is used for collecting, filtering, processing logs, and then pushing them to a storage backend.
It is essential to assess the volume of logs generated daily. For low volume with few analysis requirements, Filebeat can be used to collect logs, tag them, and push them to ElasticSearch, Clickhouse, etc.
For clusters with a large volume of logs generated daily, especially during peak loads, deploying Filebeat on each node to collect logs and push them to a Kafka cluster is advisable. Logstash can then gradually consume the Kafka logs and push them to ElasticSearch. This approach facilitates traffic throttling and easy horizontal scaling to accommodate high throughput while meeting additional log processing needs.
The Logging Backend is the storage for logs, with ElasticSearch and Clickhouse being popular choices. Both support distributed deployment, but Clickhouse is slightly cheaper, albeit with a more complex learning curve. Therefore, ElasticSearch will mainly be utilized for the storage backend.

For tracing and metrics, OpenTelemetry Collector can be used as a unified access layer, then forwarding to various solutions. The advantage is that applications only need to have a single unified push address, and they can integrate with OpenTelemetry SDK while operations teams can configure the Collector to be bound to different backend storage services.
The OpenTelemetry Collector itself does not store any data; it serves as a unified access layer that implements the OpenTelemetry protocol and forwards data to the corresponding backend storage services, needing to be paired with Logs, Traces, and Metrics.
For instance, Traces can use Jaeger or Skywalking + ElasticSearch, while Metrics can use Prometheus + Grafana. Application services need not concern themselves with the specific implementation details, just pushing data to the OpenTelemetry Collector service, while operations can configure the Collector to forward data to specific storage backends.
Of course, the OpenTelemetry Collector also supports applications pushing logs, but generally, collectors are set up on the host machine.

Many observability components are already compatible with the OpenTelemetry protocol and can receive data directly without the OpenTelemetry Collector, which will be elaborated on later.
This is the general plan adopted; the next section will delve into the specific implementation details.
Logging Solution
Storage Backend ElasticSearch + Kibana
The most common logging storage and indexing solution is ElasticSearch + Kibana. Although ElasticSearch tends to consume more resources, it is relatively easy to maintain, has abundant documentation, and can be easily expanded into a cluster. Configuring log retention policies is also straightforward, making ElasticSearch the preferred choice for logging storage services.
In this chapter, ElasticSearch will be deployed in a single-node setup. The ElasticSearch and Kibana instances will not create networks or storage volumes but will expose ports directly as nodes, with local directories for persistent storage.
Create directories /data/elasticsearch/data and /data/elasticsearch/config to store the ElasticSearch configuration files and data, setting directory permissions to 755.
Start an ElasticSearch instance:
docker run -itd --name elasticsearch -m 2GB  \
--restart=always   \
--publish 9200:9200   \
--env discovery.type=single-node   \
--env xpack.security.authc.api_key.enabled=true   \
-v /data/elasticsearch/data:/usr/share/elasticsearch/data   \
docker.elastic.co/elasticsearch/elasticsearch:9.1.3(http://nps.local.whuanle.cn:36006/images)
It is advisable to limit the memory settings when deploying ElasticSearch, as it can consume substantial host resources.
If you need the ElasticSearch configuration files to be accessible, you can copy them to the config directory first:
docker cp elasticsearch:/usr/share/elasticsearch/config ./Then remove the container and recreate it:
docker rm -f elasticsearch
docker run -itd --name elasticsearch -m 2GB  \
--restart=always   \
--publish 9200:9200   \
--env discovery.type=single-node   \
--env xpack.security.authc.api_key.enabled=true   \
-v /data/elasticsearch/config:/usr/share/elasticsearch/config   \
-v /data/elasticsearch/data:/usr/share/elasticsearch/data   \
docker.elastic.co/elasticsearch/elasticsearch:9.1.3
Next, access the container to initialize the passwords for the elastic, kibana_system, and logstash_system accounts.
docker exec -it elasticsearch bashOnce inside the container, navigate to the bin directory.

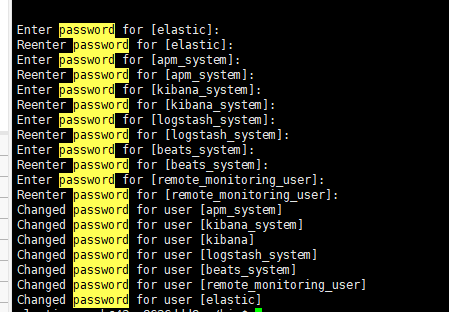
Execute ./elasticsearch-reset-password -u elastic, ./elasticsearch-reset-password -u kibana_system, and ./elasticsearch-reset-password -u logstash_system, and copy the output passwords.
Alternatively, you can run ./elasticsearch-setup-passwords interactive and follow the prompts to choose which accounts to reset passwords for.
It is recommended to use random passwords. If the passwords are too simple, Kibana will display the error
Error: [config validation of [elasticsearch].password]: expected value of type [string] but got [number].
Test if ElasticSearch has been deployed successfully:
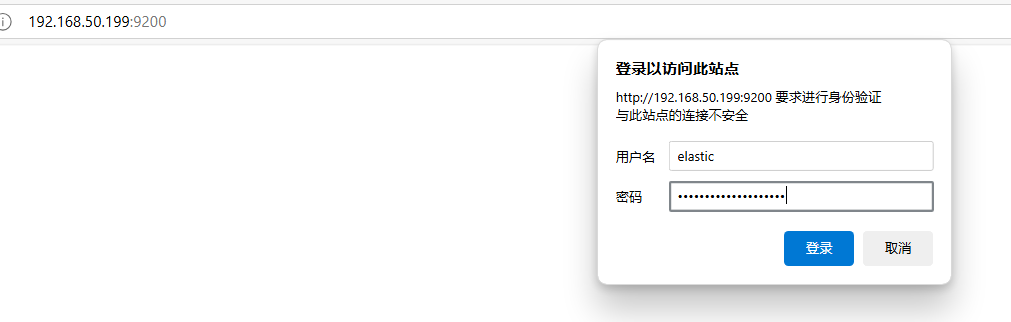
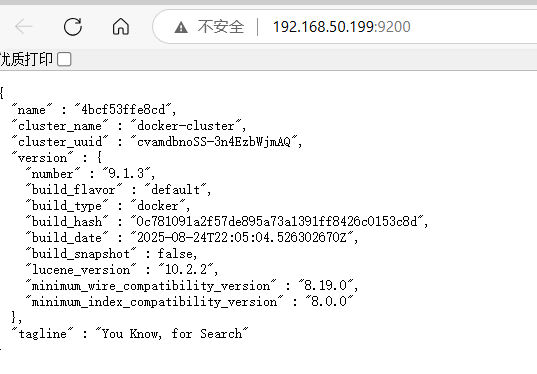
curl -u elastic http://localhost:9200/
Alternatively, opening the address in a browser and entering the elastic account password should grant access, indicating a successful deployment.
Next, we will deploy Kibana. Since Kibana is stateless, it only requires the relevant environment variables to be registered without mapping directories.
docker run --name kibana --restart=always   \
-itd   --publish 5601:5601   \
--env ELASTICSEARCH_HOSTS="http://192.168.50.199:9200"  \
--env ELASTICSEARCH_USERNAME=kibana_system   \
--env ELASTICSEARCH_PASSWORD='password'   \
docker.elastic.co/kibana/kibana:9.1.3ELASTICSEARCH_HOSTSis the IP and port of the node where the ElasticSearch container is located.ELASTICSEARCH_USERNAMEandELASTICSEARCH_PASSWORDare the account credentials, with the account fixed askibana_system.
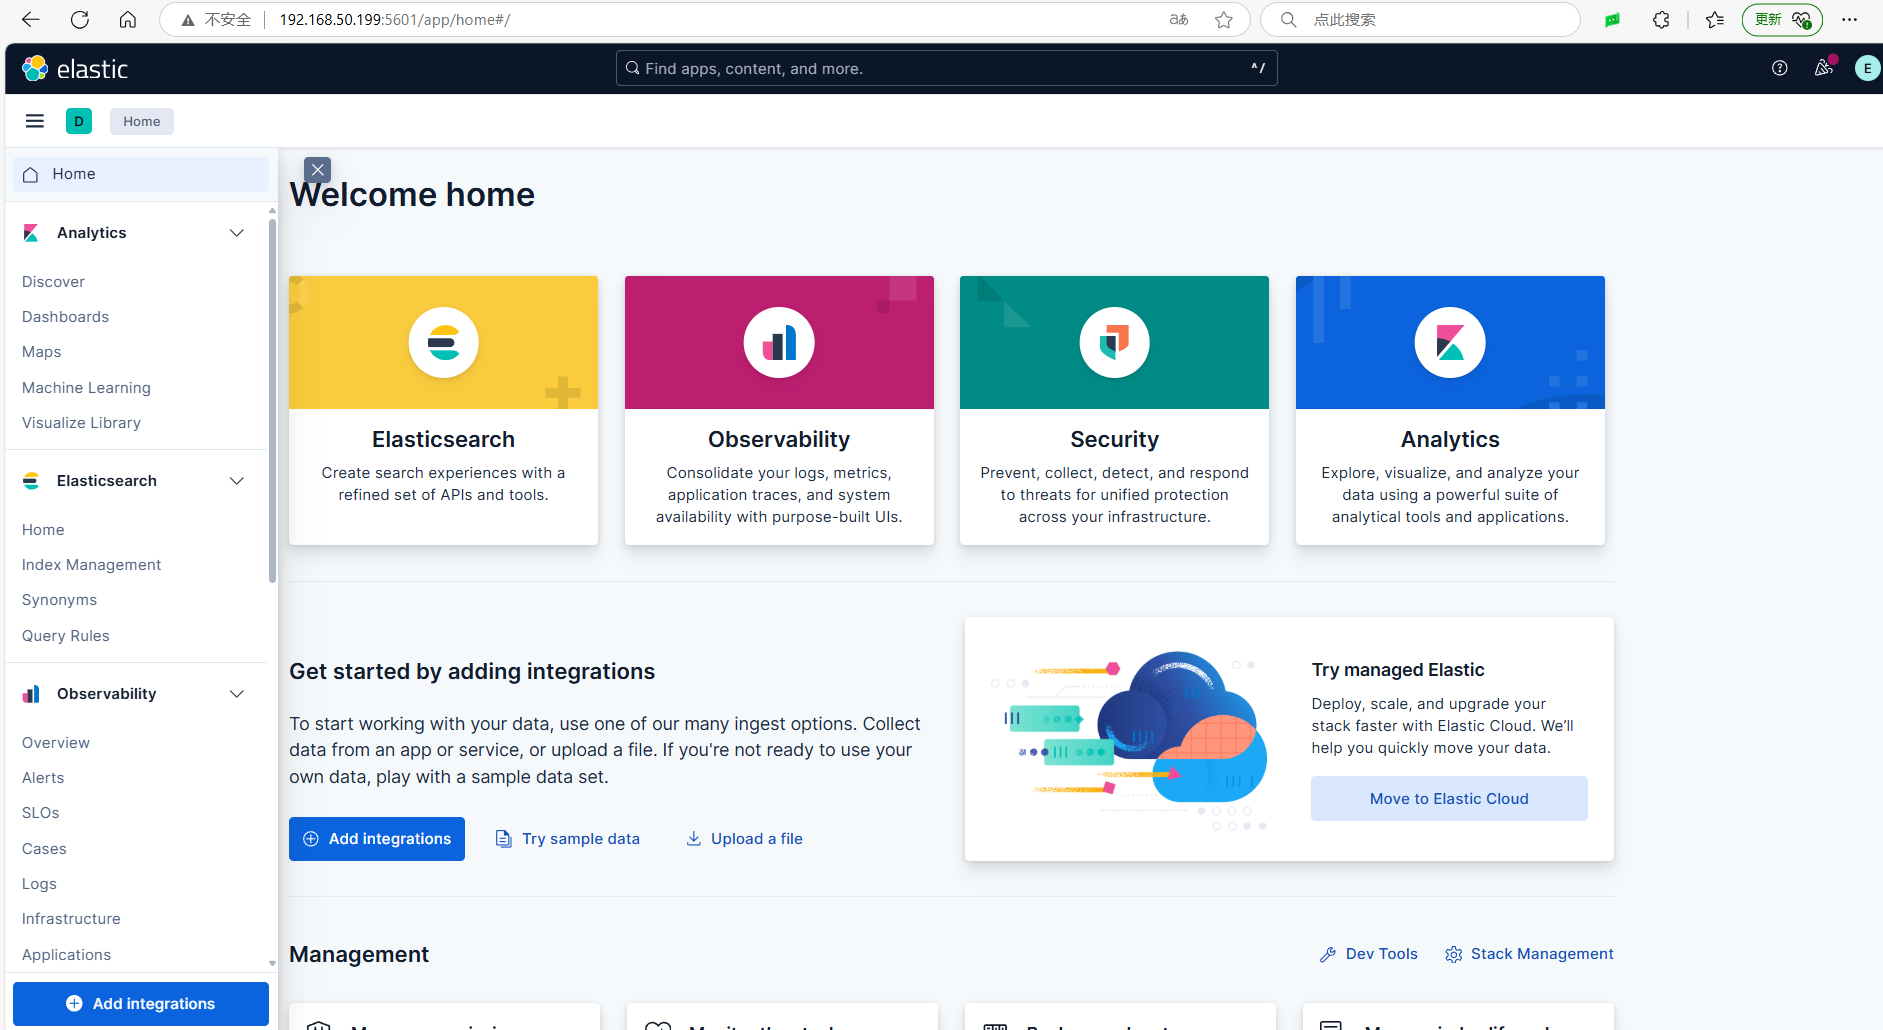
Thus, the deployment of ElasticSearch and Kibana is complete.
Log Collection Solution
There are numerous solutions available in the open-source community, with commonly used tools such as Logstash, Fluentd/Fluentbit, and Filebeat. For instance, Logstash is the logging component in the renowned ELK stack. While Logstash has powerful functionalities, it can also consume a lot of resources, which may be excessive for collecting logs either in a cluster or on a single node.
Therefore, I mainly use Filebeat for log collection, and readers can confirm the specific method they wish to use based on their needs.
Filebeat is one of Elastic's products, and its documentation can be found here: https://elastic.ac.cn/docs/reference/beats/filebeat/how-filebeat-works
For scenarios where only logs need to be collected and forwarded, Filebeat is lightweight, supports Docker deployment, and can also support direct output to Kafka, ElasticSearch, etc. without the need for additional plugins.
The ability to support multiple interfaces without additional plugins is crucial. Initially, I tried Fluentd, but the requirement for extra plugins made deployment too cumbersome, which led me to abandon Fluentd.
The proposed solution is Filebeat + Kafka + Logstash. If you have fewer servers and your daily log volume is not large, you can directly use Filebeat to push logs to ElasticSearch.
For scenarios with larger log volumes in a cluster, each node can use Filebeat to push logs to Kafka, then Logstash can consume and process them from Kafka before sending them to ElasticSearch.
Using Kafka for traffic throttling is advantageous since the log volume can be significantly large in a short period; if ElasticSearch becomes overwhelmed, it could crash. Kafka allows for collective deployment to manage traffic spikes.
Logstash can be deployed in a single-node setup because it has high throughput capability. Even with multiple Filebeat instances pushing to Kafka simultaneously, Logstash can handle the load. Additionally, Kafka has persistence capabilities, meaning if a single-node Logstash consumes slower, the issue can be resolved later by deploying multiple Logstash instances.
Multiple Logstash nodes do not require distributed communication coordination since they utilize the same Consumer to subscribe to the Kafka topic. Kafka will balance the message distribution among the instances, making it easy to scale out.
Configuring Filebeat is quite straightforward. If you are directly using Filebeat to push logs to ElasticSearch, you only need the following configuration:
This is for demonstration purposes only and should not be used as-is.
filebeat.config:
  modules:
    path: ${path.config}/modules.d/*.yml
    reload.enabled: false

filebeat.autodiscover:
  providers:
    - type: docker
      hints.enabled: true

processors:
- add_cloud_metadata: ~

output.elasticsearch:
  hosts: '${ELASTICSEARCH_HOSTS:elasticsearch:9200}'
  username: '${ELASTICSEARCH_USERNAME:}'
  password: '${ELASTICSEARCH_PASSWORD:}'
Configuration content references: raw.githubusercontent.com/elastic/beats/9.0/deploy/docker/filebeat.docker.yml
Deploying Kafka
Since the internal network's log volume is not substantial, a single instance suffices.
Create the following directories:
mkdir -p /data/kafka/broker/logs
mkdir -p /data/kafka/broker/data
chmod -R 777 /data/kafka
In the /data/kafka directory, create the docker-compose.yml file:
services:
  kafka:
    image: apache/kafka-native
    ports:
      - "9092:9092"
      - "9093:9093"
    volumes:
      - /data/kafka/broker/logs:/opt/kafka/logs  # Persist logs and data
      - /data/kafka/broker/data:/opt/kafka/data
    environment:
      # Configure listeners for both docker and host communication
      KAFKA_LISTENERS: CONTROLLER://:9091,HOST://0.0.0.0:9092,DOCKER://0.0.0.0:9093
      KAFKA_ADVERTISED_LISTENERS: HOST://192.168.50.199:9092,DOCKER://kafka:9093
      KAFKA_LISTENER_SECURITY_PROTOCOL_MAP: CONTROLLER:PLAINTEXT,DOCKER:PLAINTEXT,HOST:PLAINTEXT

      # Settings required for KRaft mode
      KAFKA_NODE_ID: 1
      KAFKA_PROCESS_ROLES: broker,controller
      KAFKA_CONTROLLER_LISTENER_NAMES: CONTROLLER
      KAFKA_CONTROLLER_QUORUM_VOTERS: 1@localhost:9091

      # Listener to use for broker-to-broker communication
      KAFKA_INTER_BROKER_LISTENER_NAME: DOCKER

      # Required for a single node cluster
      KAFKA_OFFSETS_TOPIC_REPLICATION_FACTOR: 1

  kafka-ui:
    image: kafbat/kafka-ui:main
    ports:
      - 8080:8080
    environment:
      DYNAMIC_CONFIG_ENABLED: "true"
      KAFKA_CLUSTERS_0_NAME: local
      KAFKA_CLUSTERS_0_BOOTSTRAPSERVERS: kafka:9093
    depends_on:
      - kafka
In a production environment, it is recommended to deploy a Kafka cluster as needed; do not use a single-node Kafka instance.
If UI functionality is not needed, the
kafka-uiservice can be removed.
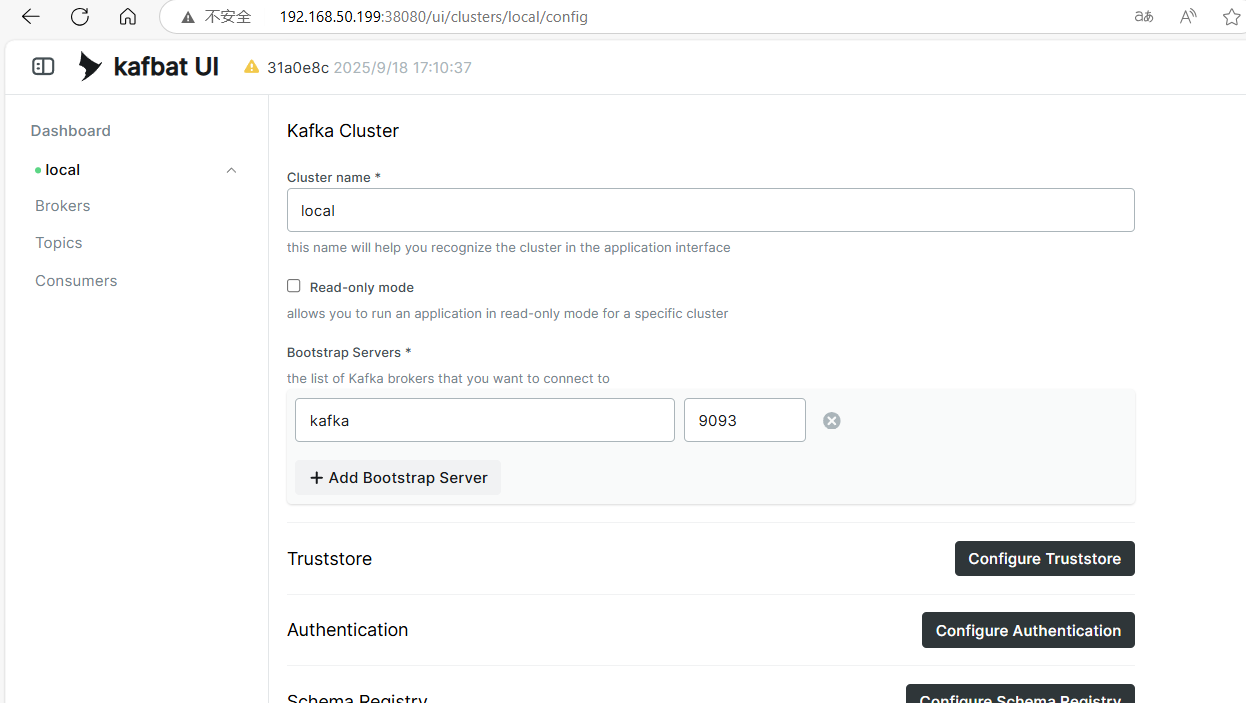
Open the kafka-ui port and fill in the Kafka address.
Note: The author actually uses port 38080, and for managing Kafka, the 9093 port should be used instead of 9092.
Deploying Filebeat
Filebeat supports collecting multi-line messages, AWS S3, Azure Blob Storage, container logs, Kafka, and various log sources for centralized log management. For detailed information, refer to: https://www.elastic.co/cn/beats/filebeat
Filebeat supports bare metal, Docker deployment, and cluster deployment. Regarding maintenance methods, Docker deployment is used here to collect logs from the host machine. Below is the Kubernetes deployment outline.
docker pull docker.elastic.co/beats/filebeat:9.1.3
Create /data/filebeat/filebeat.docker.yml and the /data/filebeat/data directory.
.
The contents of the filebeat.docker.yml file are as follows:
#######################
# Filebeat Main Configuration
#######################
filebeat.inputs:
  # Docker log input (added multi-line processing)
  - type: filestream
    id: docker-logs
    paths:
      - /var/lib/docker/containers/*/*.log
    parsers:
      - container:   # Use container parser to process Docker JSON logs
          format: docker
          stream: all
    # Added multi-line configuration (key modification)
    multiline:
      type: pattern
      pattern: '^[[:space:]]'  # Match lines that start with spaces/tabs
      negate: false
      match: after
      timeout: 5s
    fields:
      log_source: docker
      log_topic: docker-logs

  # Nginx log input (unchanged)
  - type: filestream
    id: nginx-logs
    paths:
      - /var/log/nginx/*.log
    multiline:
      pattern: '^\[[0-9]{4}-[0-9]{2}-[0-9]{2}'
      negate: true
      match: after
    fields:
      log_topic: nginx-logs

processors:
  - add_host_metadata:
      when.not.contains.tags: forwarded
  - add_cloud_metadata: ~
  - add_docker_metadata: ~
  - drop_fields:
      fields: ["log.offset", "input.type", "host.uptime"]
  - drop_event.when:
      or:
        - contains.container.name: "logstash"
        - contains.container.name: "filebeat"

#######################
# Output Configuration
#######################
output.kafka:
  # initial brokers for reading cluster metadata
  hosts: ["192.168.50.199:9092"]

  # message topic selection + partitioning
  topic: '%{[fields.log_topic]}'
  partition.round_robin:
    reachable_only: false

  required_acks: 1
  compression: gzip
  max_message_bytes: 1000000
During deployment, if any runtime exceptions are encountered, you can enable the output debugging feature.
logging.level: debug # Enable debug logging
Here, Filebeat collects two types of logs: one is from Docker containers, using drop_event.when to exclude logs from the logstash and filebeat containers; the other is for collecting nginx logs. If nginx logs are not needed, nginx-logs can be removed; it is only presented here for demonstration purposes.
Readers can adjust the configuration to collect logs from directories such as /var/log and /var/lib/docker/containers/.
Log collection is not straightforward, as the logs output by different programs vary widely, and by default, Docker outputs one JSON record per line, which causes complete logs to be fragmented; thus, it is necessary to find ways to reassemble them. This will be discussed when deploying Logstash to consume the logs.
In the configuration, logs from Docker and nginx are pushed to Kafka separately, producing two topics. The topic: '%{[fields.log_topic]}' matches all topics and is related to the field variables of each inputs, which can be modified as needed.
If you are using something other than Docker or are using containerd, the log directory for containers may be /var/log/containers/*.log; readers should adjust accordingly.
Start Filebeat and map the host's log files to the Filebeat container:
docker run -d \
  --name=filebeat \
  --user=root \
  --volume="/data/filebeat/filebeat.docker.yml:/usr/share/filebeat/filebeat.yml:ro" \
  --volume="/var/run/docker.sock:/var/run/docker.sock:ro" \
  --volume="/data/filebeat/data:/usr/share/filebeat/data:rw" \
  --volume="/var/lib/docker/containers:/var/lib/docker/containers" \
  --mount type=bind,source=/var/log,target=/var/log \
  docker.elastic.co/beats/filebeat:9.1.3 filebeat -e --strict.perms=false
--strict.perms=false: Prevents startup failure due to file permission issues.
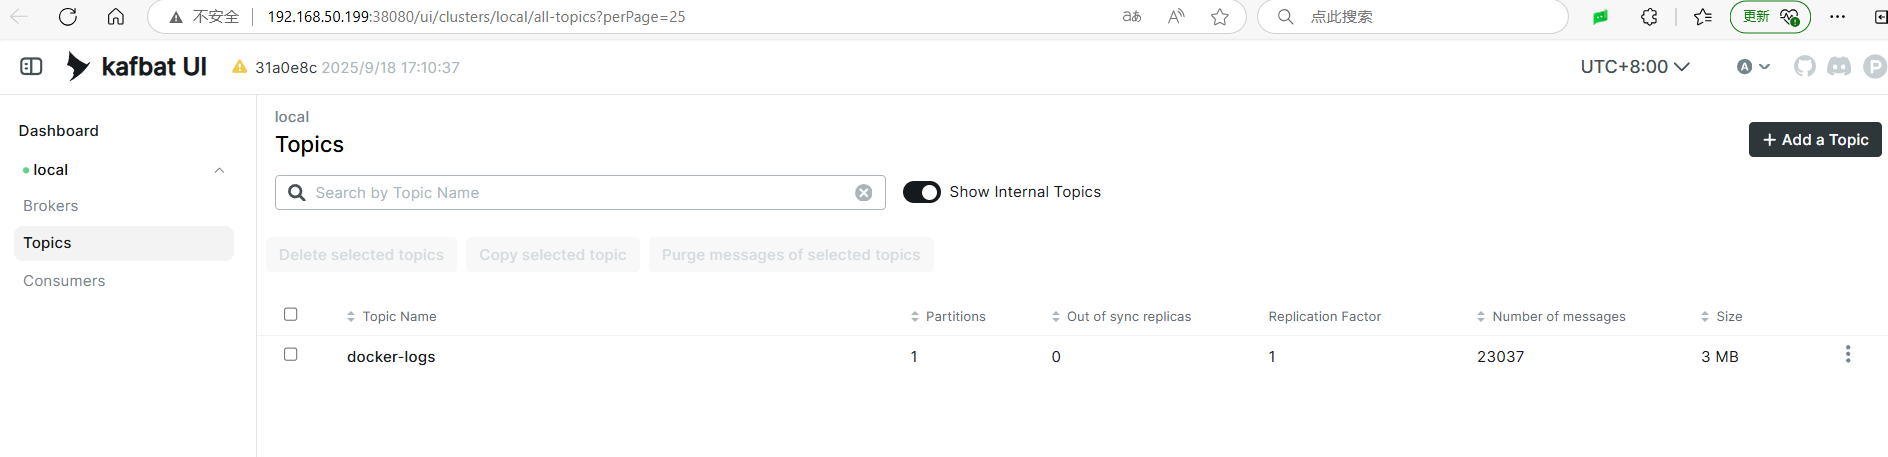
Open the Kafka UI to check if there are topics.
Log Collection Handling
The consuming logs heavily depend on the format of the logs collected and various metadata. A good collection method can significantly simplify the complex configuration for consuming logs. Therefore, this section explains how to correctly handle log files during the collection phase.
Basic requirements: Add or remove unnecessary fields, handle different log formats: JSON, single line, multi-line, exception stack traces, and during log processing, it is vital to attach information such as the environment, node name, container/service name, etc.
The first category is JSON log format, which is recommended for microservices. Backend services generate JSON formatted logs using logging frameworks, with each line being a JSON object. Multi-line text is compressed into a field, making JSON logs convenient for collection and analysis, and they can carry context and metadata.
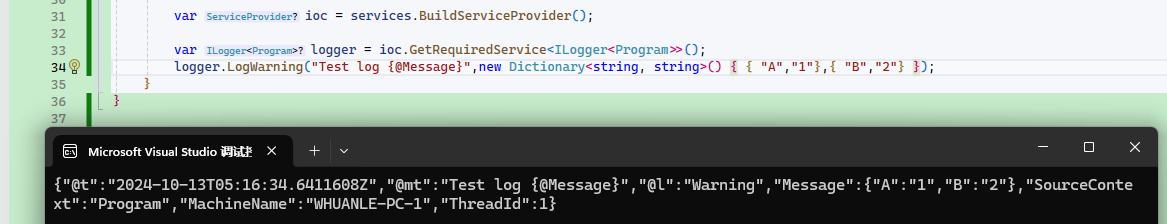
The C# program can refer to the author's tutorial: https://maomi.whuanle.cn/3.2.serilog.html#serilog-日志格式模板
When pushing to Elasticsearch, JSON fields can create fields in Elasticsearch, making it easy to search and filter. For instance, if the logging framework has a fixed "@tr" attribute for service output tracking ID, it can be used to find all logs associated with a request through its ID.
{"log.level":"warn","@timestamp":"2025-09-19T03:39:29.165Z","log.logger":"input.scanner","log.origin":{"function":"github.com/elastic/beats/v7/filebeat/input/filestream.(*fileScanner).GetFiles","file.name":"filestream/fswatch.go","file.line":421},"message":"1 file is too small to be ingested, files need to be at least 1024 in size for ingestion to start. To change this behaviour set 'prospector.scanner.fingerprint.length' and 'prospector.scanner.fingerprint.offset'. Enable debug logging to see all file names.","service.name":"filebeat","filestream_id":"docker-logs","ecs.version":"1.6.0"}Single line logs have no specific format, with all content compressed into one line, making it challenging to carry context information and difficult to read.
Handling single line logs is relatively simple; however, if the program throws a stack trace or needs to output multiple lines as attributes, it can result in one log being split into multiple lines, leading to poor log quality and information fragmentation.
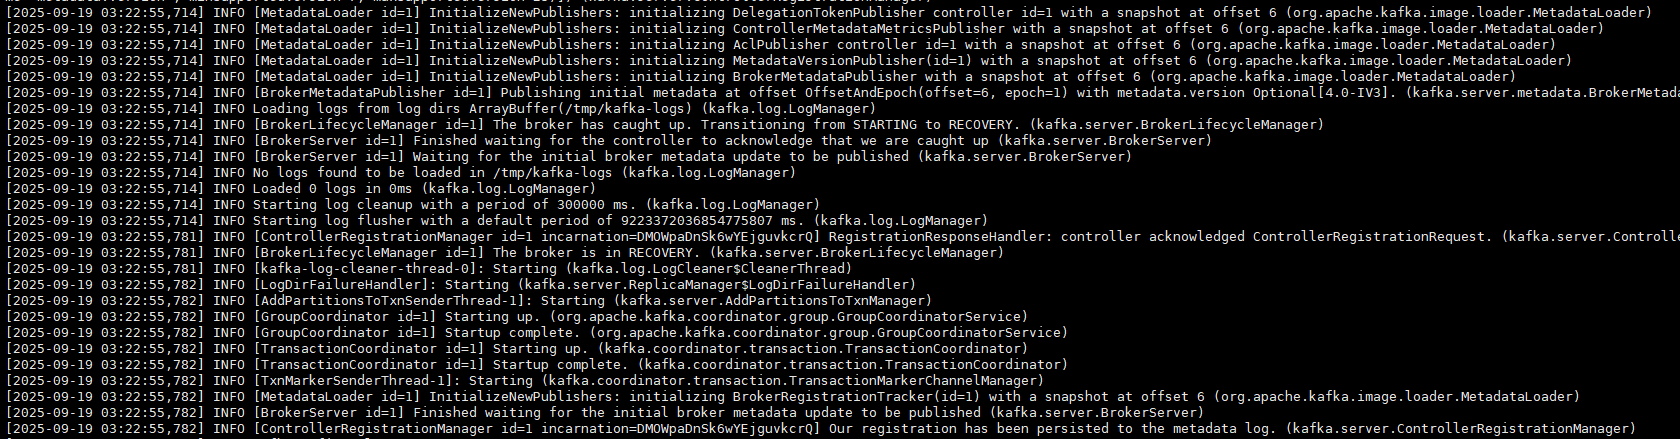
Docker generates one JSON output for each log line, for example:
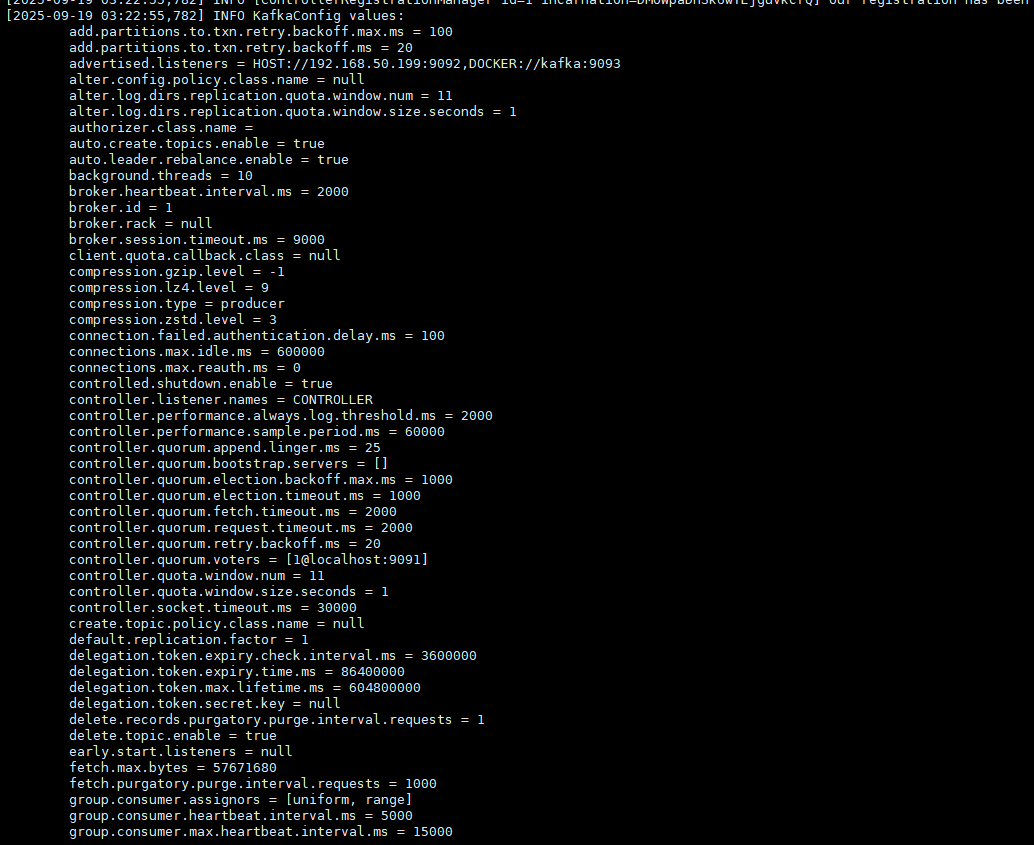
[2025-09-19 03:22:55,782] INFO KafkaConfig values:
    add.partitions.to.txn.retry.backoff.max.ms = 100
    add.partitions.to.txn.retry.backoff.ms = 20
Docker's log handling is quite straightforward; it does not concern itself with the format or structure of the log content, including multi-line logs. Docker simply captures the standard output (stdout) and standard error (stderr) streams of the container, and outputs each line separated by a newline character \n in JSON format to the container log file.
Thus, three lines of logs are generated:
{"log":"[2025-09-19 03:22:55,782] INFO KafkaConfig values: \n","stream":"stdout","time":"2025-09-19T03:22:55.782123456Z"}
{"log":"\tadd.partitions.to.txn.retry.backoff.max.ms = 100\n","stream":"stdout","time":"2025-09-19T03:22:55.782234567Z"}
{"log":"\tadd.partitions.to.txn.retry.backoff.ms = 20\n","stream":"stdout","time":"2025-09-19T03:22:55.782345678Z"}
Thus, both the collection and consumption of logs must consider various log format issues.
To ensure efficient log collection and consumption, Filebeat only cares about whether the log is single line or multi-line, and is responsible for outputting a complete portion of the logs early on.
So in the filebeat.docker.yml file, there is this configuration section:
multiline:
  type: pattern
  pattern: '^[[:space:]]'  # Identify indented lines (like stack traces)
  negate: false            # Directly match the pattern
  match: after             # Merge into the previous line
  timeout: 5s              # Multi-line group waiting time
For other more specialized formats, readers need to find their own parsing methods.
Although Filebeat also supports JSON parsing and various validation rules, for performance and speed considerations, it only processes single-line and multi-line logs before pushing them to Kafka.
Process:
Docker Containers
      ↓ (stdout/stderr)
/var/lib/docker/containers/*.log
      ↓
Filebeat (multi-line merging + Docker metadata)
      ↓ (Kafka Producer)
Kafka Topic: raw-docker-logs
      ↓ (Kafka Consumer)
Logstash (JSON detection + field processing)
      ↓
Elasticsearch Index: docker-{container name}-*
Log Consumption
The aim is to consume logs from Kafka, clean them, and push them to Elasticsearch.
Since the author's requirements are modest, it is sufficient to consume the logs, label them, and push them to Elasticsearch.
In the /data/logstash directory, create a logstash.conf file with the following content:
# logstash.conf
input {
  kafka {
    bootstrap_servers => "192.168.50.199:9092"
    topics => ["docker-logs"]
    codec => "json"  # Parse the JSON format output from Filebeat
  }
}

filter {
  # Extract Docker container metadata
  ruby {
    code => '
      if container_id = event.get("[container][id]")
        event.set("container_name", event.get("[container][name]") || container_id[0..11])
      end
    '
  }

  # Intelligent JSON detection (key)
  if [message] =~ /^{.*}$/ {
    json {
      source => "message"
      target => "json_content"
      remove_field => ["message"]
    }
  }

  # Clean up common fields
  mutate {
    remove_field => [
      "agent", "ecs", "input", "log", "host"
    ]
  }
}

output {
  elasticsearch {
    hosts => ["http://192.168.50.199:9200"]
    index => "docker-%{[container][name]}-%{+YYYY.MM.dd}"
    user => "ES_account"
    password => "ES_password"
    ssl_enabled  => false
  }

  # For debugging (optional)
  stdout {
    codec => rubydebug
  }
}
Note that logs pushed to Elasticsearch will have a
docker-prefix in the index; this can be modified as desired.If you need to enable Elasticsearch SSL:
ssl_enabled => true
ssl_certificate_verification => true
cacert => "/path/to/ca.crt"
Start the Logstash service.
docker pull docker.elastic.co/logstash/logstash:9.1.4
# For domestic networks: docker pull logstash:9.1.4
docker run --name logstash -itd --restart=always \
-v /data/logstash/logstash.conf:/usr/share/logstash/pipeline/logstash.conf \
docker.elastic.co/logstash/logstash:9.1.4
# For domestic networks, use the following command
docker run --name logstash -itd --restart=always \
-v /data/logstash/logstash.conf:/usr/share/logstash/pipeline/logstash.conf \
logstash:9.1.4Check the Logstash logs, which indicate it is consuming from Kafka:
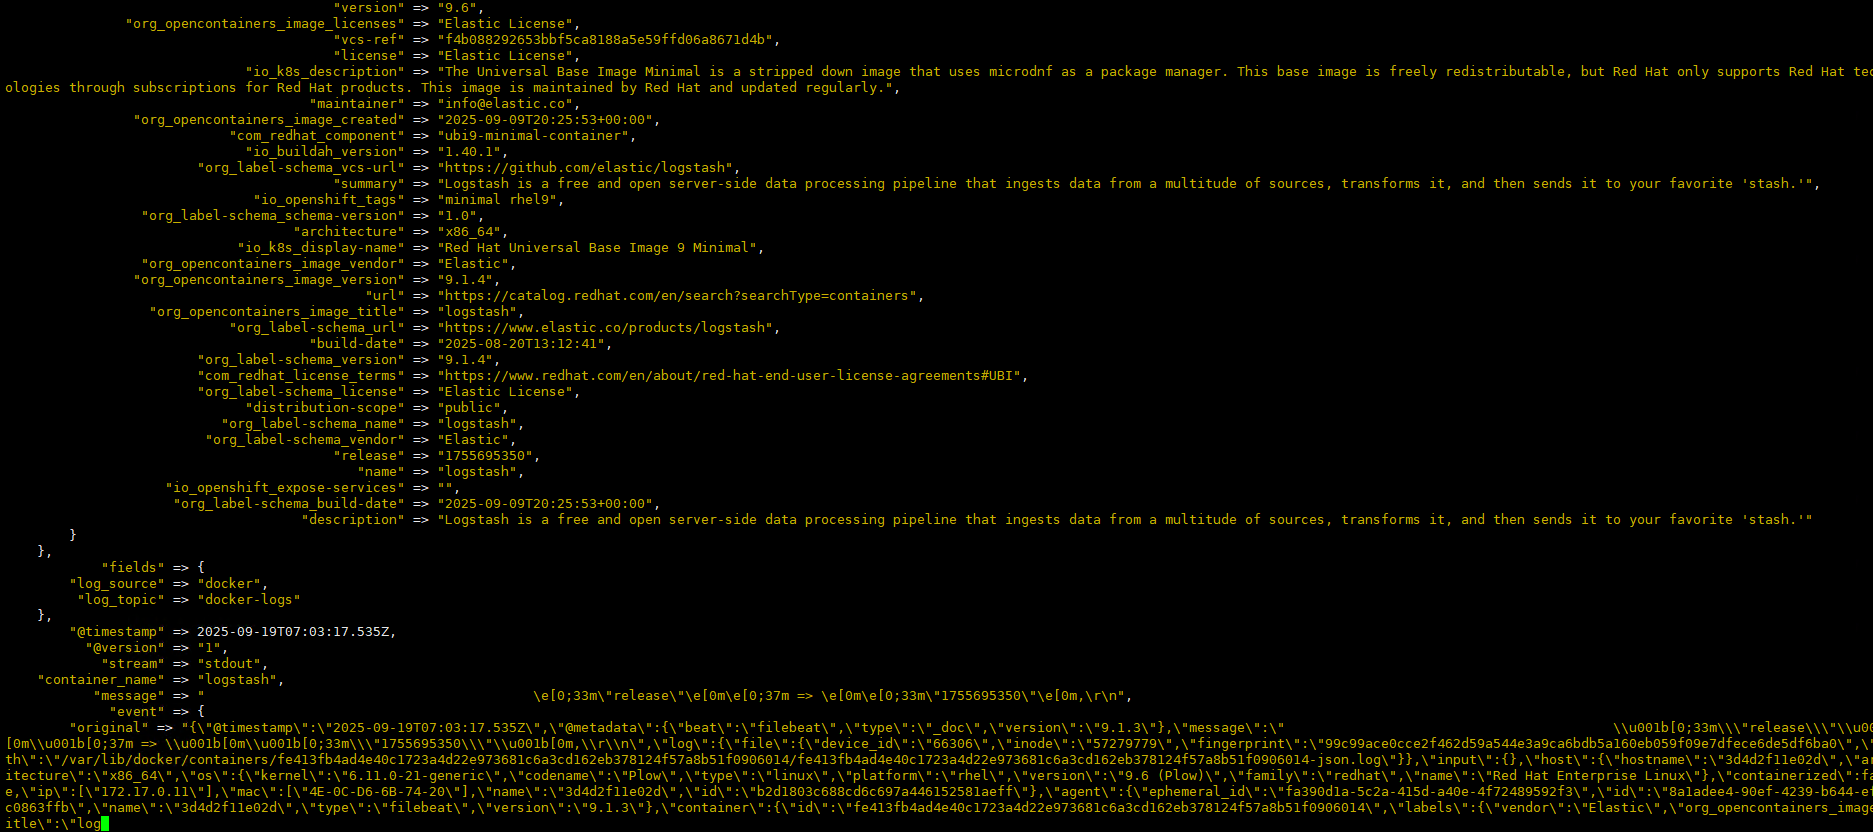
Logstash has great consumption capabilities; shortly after starting, it processed around 30 million logs.
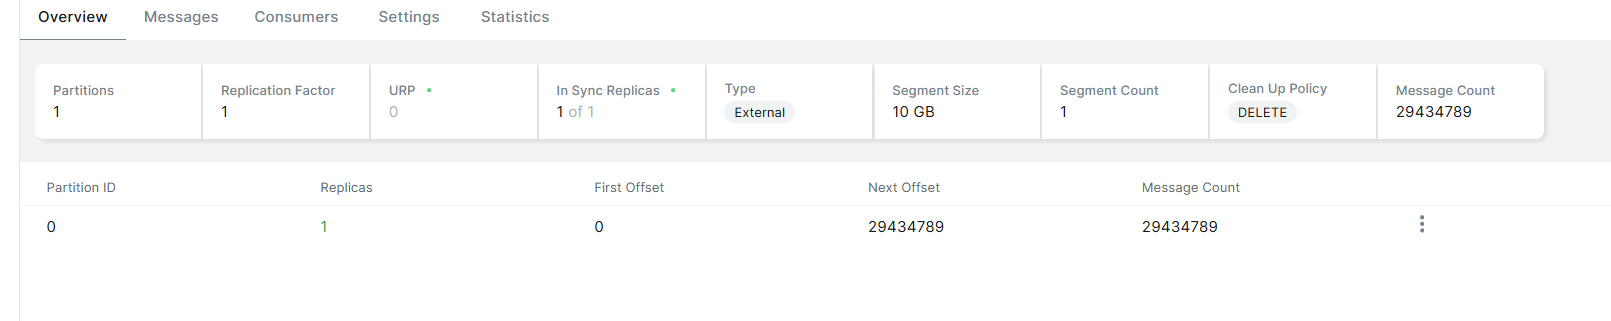
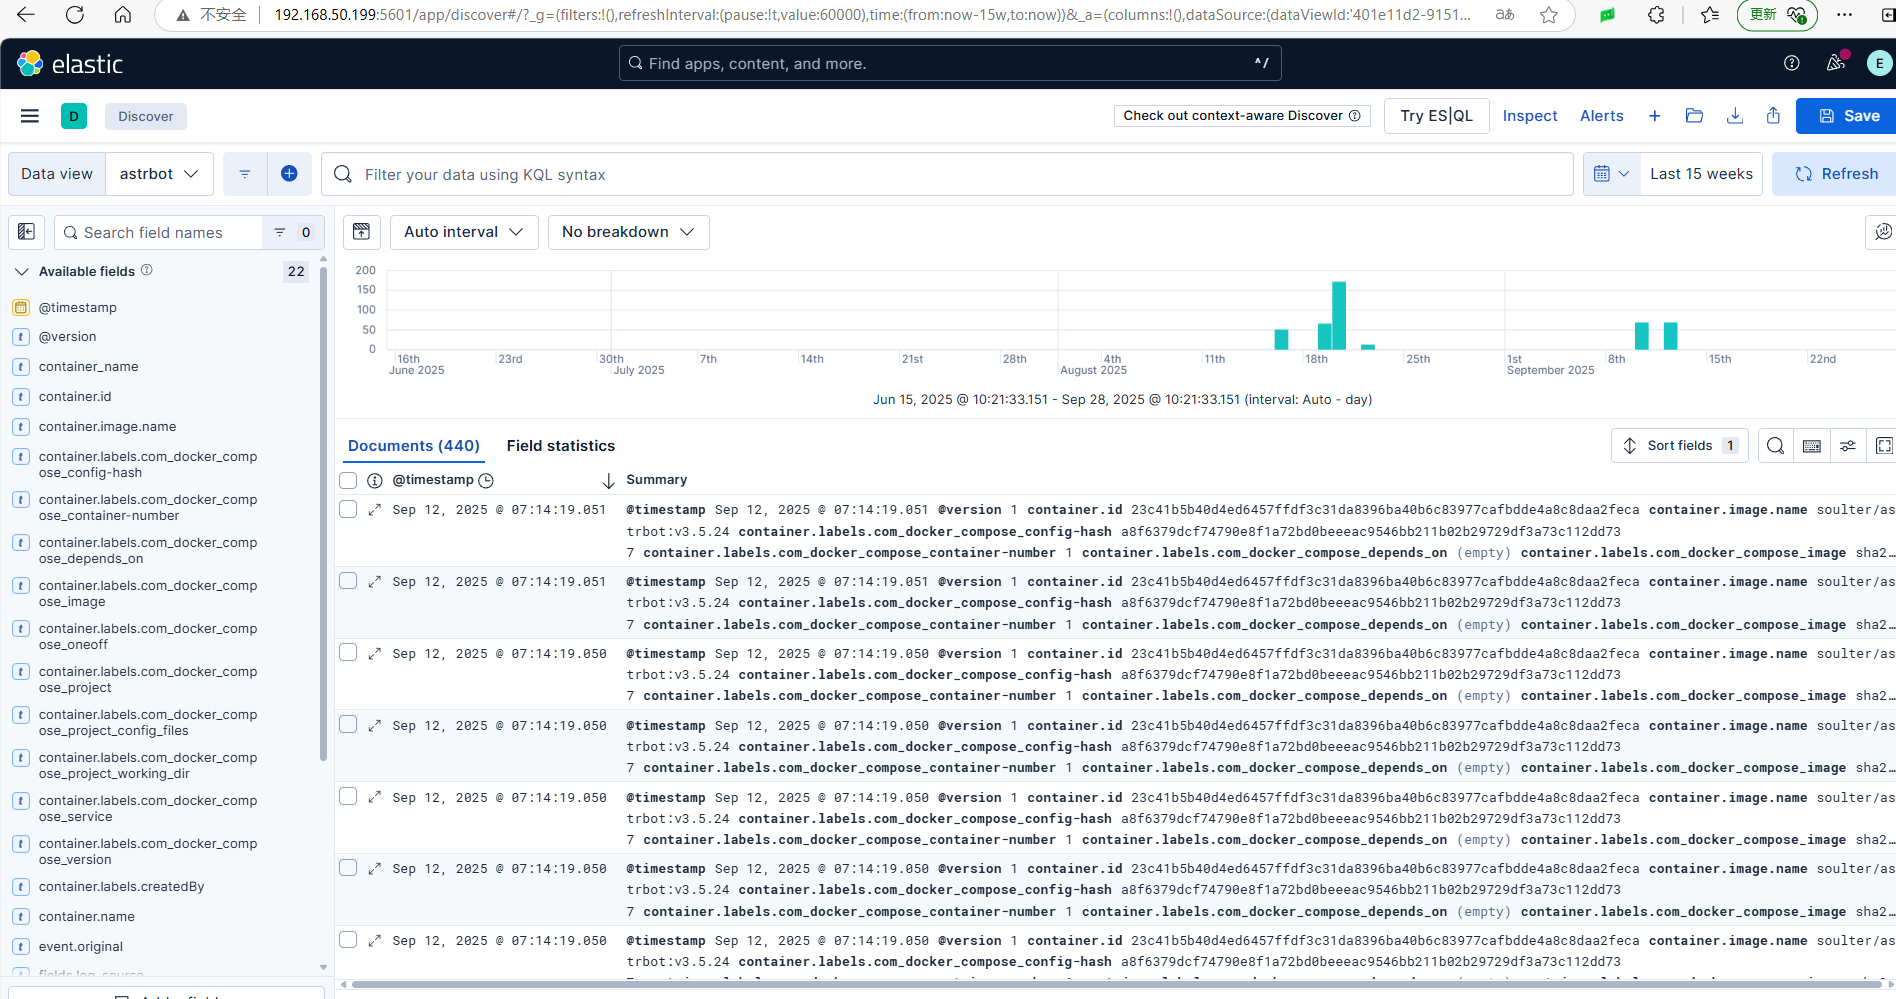
Check that Elasticsearch has outputted the corresponding container index logs.
Here, it has a
docker-prefix; if not needed, you can modify theindex => "docker-%{[container][name]}-%{+YYYY.MM.dd}"in logstash.conf.
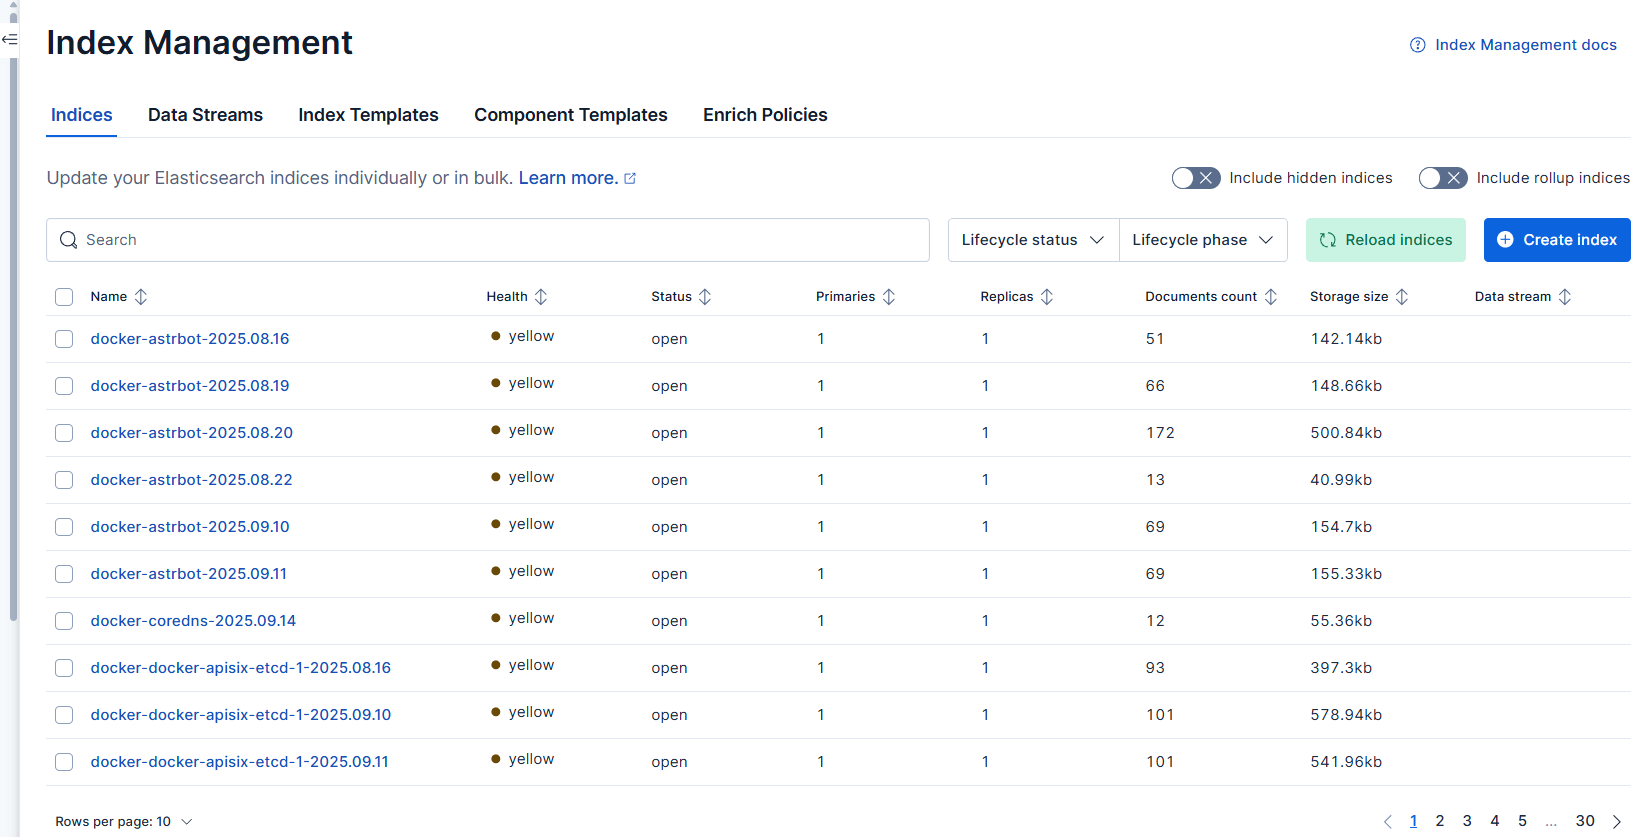
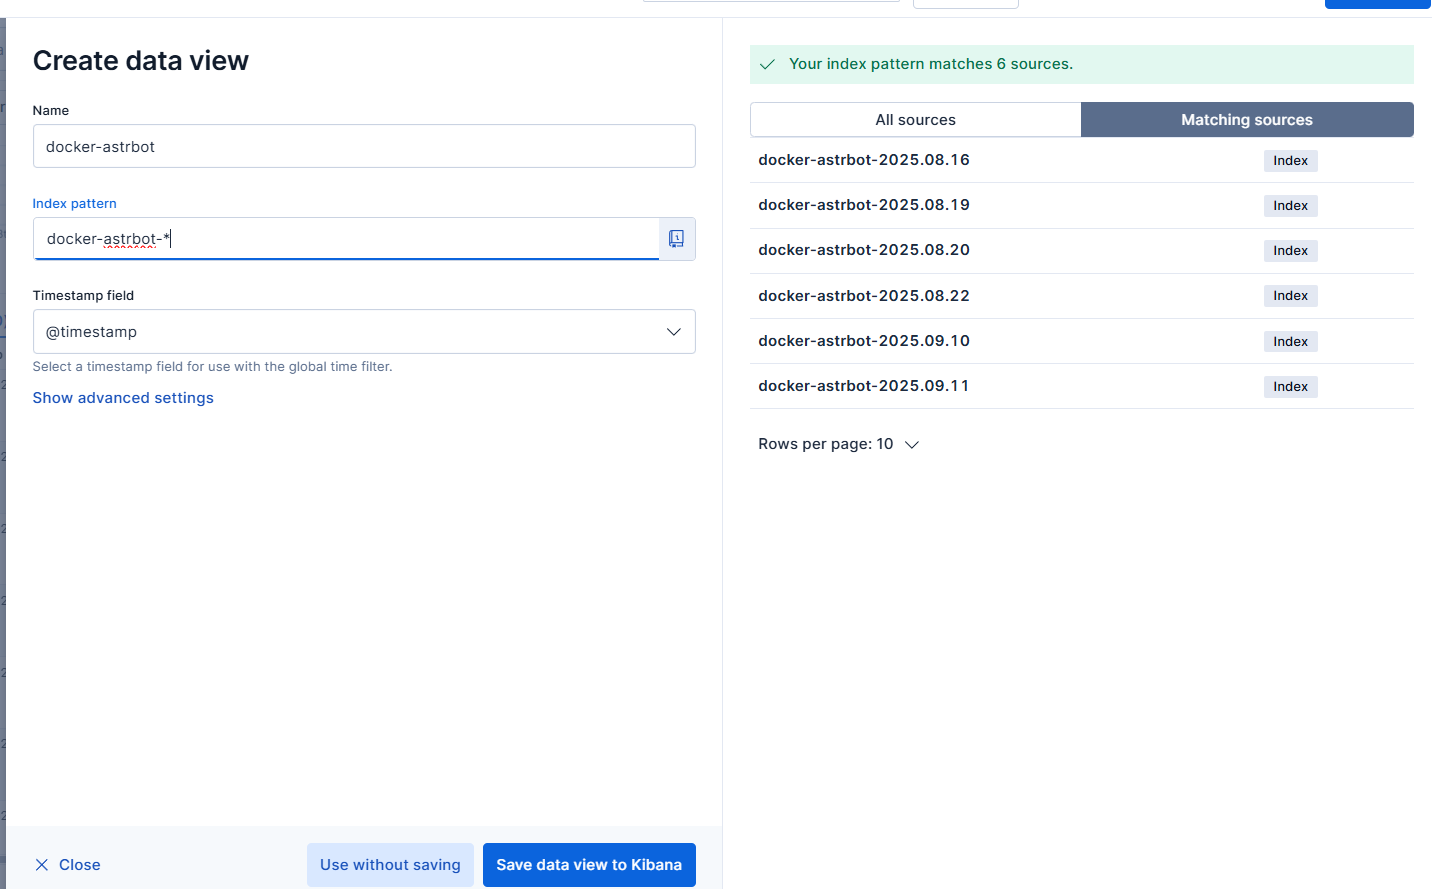
To search and view logs by service name in the interface, you need to go to Discover and add a new view.
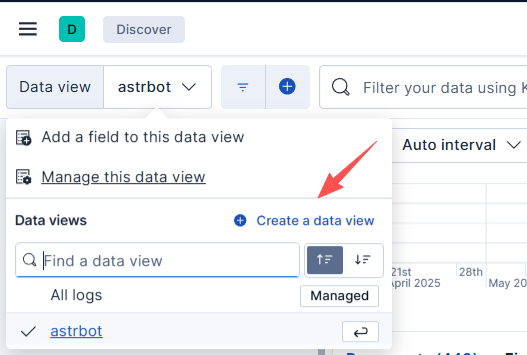
For example, to view logs from the astrbot container, since logs are generated daily, you will need to check docker-astrbot-* for all related logs, and then you can view all the dates' logs for astrbot.
Monitoring Solution
Metrics undoubtedly pair well with Prometheus + Grafana. The components involved in this article include Prometheus, Grafana, Pushgateway, Node Exporter, MySQL Exporter, etc.
Prometheus only needs to collect Pushgateway data, and each data source can push to Pushgateway, saving a lot of configuration troubles for Prometheus.
Now let's directly proceed to the deployment process.
Pulling images:
docker pull prom/pushgateway
docker pull prom/prometheus
Creating two directories:
/data/prometheus/config
/data/prometheus/data
First, deploy the pushgateway.
docker run -d --restart=always --name pushgateway -p 9091:9091 prom/pushgatewayCreate a prometheus.yml file in the /data/prometheus/config directory.
global:
  scrape_interval: 15s
  evaluation_interval: 15s
  scrape_timeout: 10s

scrape_configs:
  # Monitoring Prometheus itself
  - job_name: 'prometheus'
    static_configs:
      - targets: ['localhost:9090']

  # Pushgateway monitoring (key configuration)
  - job_name: 'pushgateway'
    honor_labels: true  # Key configuration: retain pushed original labels
    static_configs:
      - targets: ['192.168.50.199:9091']  # Replace with the actual IP and port of pushgateway
        labels:
          env: 'prod'
          component: 'batch_jobs'  # Label according to actual use
Deploy Prometheus:
docker run -itd --restart=always -p 9090:9090 \
-v /data/prometheus/config/prometheus.yml:/prometheus/prometheus.yml \
-v /data/prometheus/data:/prometheus \
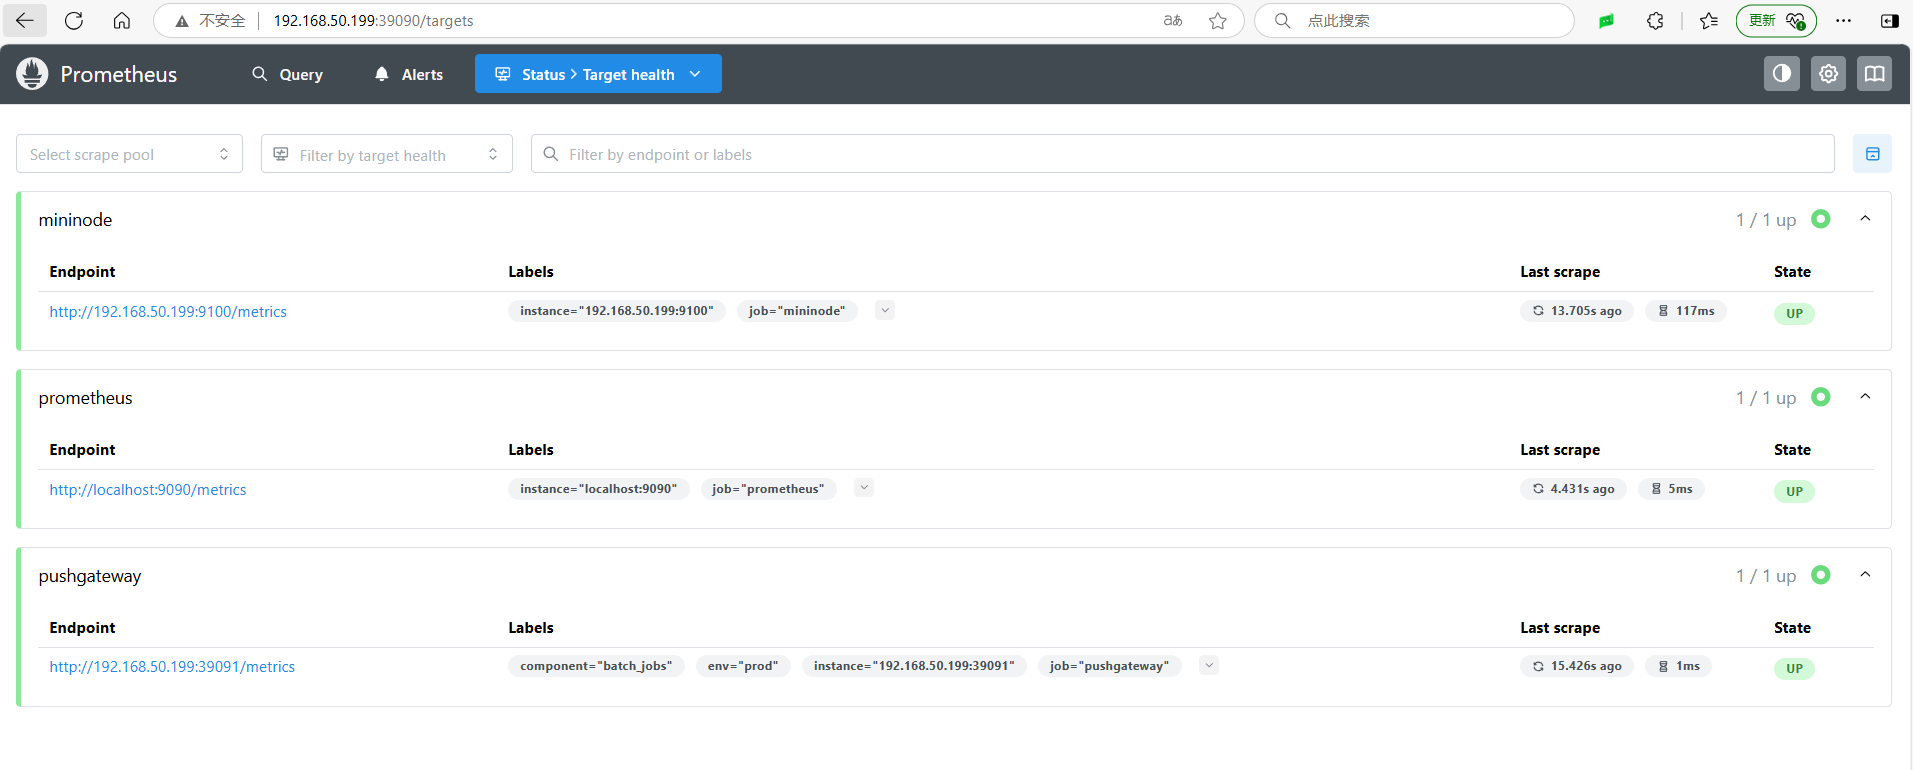
prom/prometheusAfter deployment, open the Prometheus address to check if the data source is accessible.
Deploy node_exporter
The goal is to monitor machine CPU, memory, network, etc.
Download the latest version of node_exporter from GitHub: https://github.com/prometheus/node_exporter/releases/tag/v1.9.1
tar -zvxf node_exporter-1.9.1.linux-amd64.tar.gz
mv node_exporter-1.9.1.linux-amd64/node_exporter /usr/local/bin/
Create a system startup item:
cd /etc/systemd/system
nano node_exporter.service
The content of node_exporter.service is as follows:
[Unit]
Description=Node Exporter
Documentation=https://prometheus.io/docs/guides/node-exporter/
Wants=network-online.target
After=network-online.target

[Service]
User=nobody
Group=nogroup
Type=simple
# Start Node Exporter, default port is 9100
ExecStart=/usr/local/bin/node_exporter \
  --collector.systemd \
  --collector.processes \
  --collector.filesystem.ignored-mount-points="^/(sys|proc|dev|host|etc)($$|/)"

[Install]
WantedBy=multi-user.target
Configure to start at boot:
sudo systemctl daemon-reload
sudo systemctl start node_exporter
sudo systemctl enable node_exporter
sudo systemctl status node_exporter
Modify the prometheus.yml file to include:
  - job_name: mininode
    static_configs:
    - targets: ['192.168.50.199:9100']
Restart the Prometheus container.
Deploy Grafana
Create the /data/grafana/storage directory.
mkdir /data/grafana/storage
docker run -d -p 3000:3000 --name=grafana \
  --volume /data/grafana/storage:/var/lib/grafana \
  grafana/grafana:12.1.1
Open the browser on port 3000, with default username and password both as admin; it will prompt to change the password on the first login.
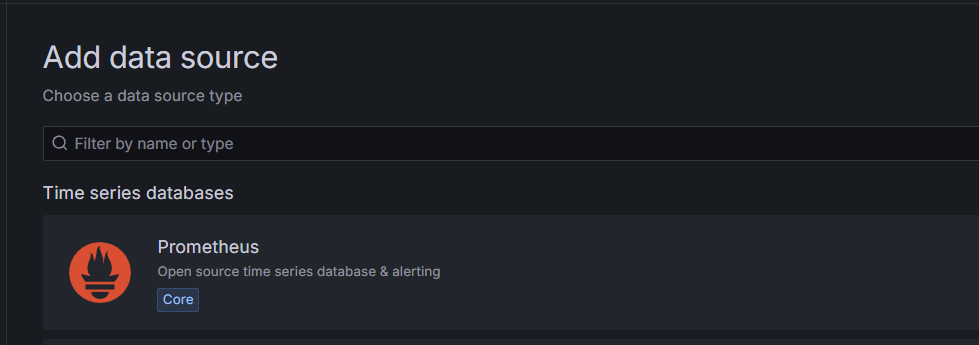
You need to configure the data source in Grafana to connect to Prometheus.
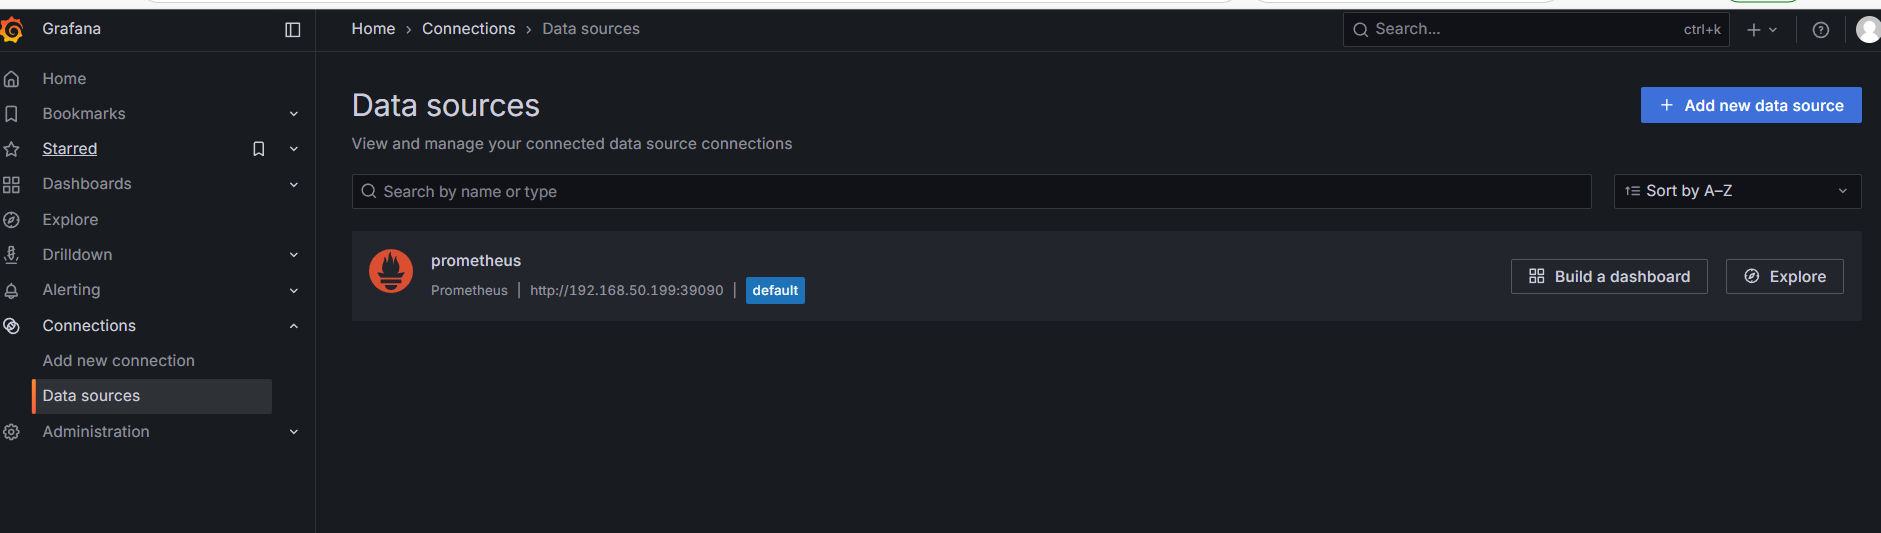
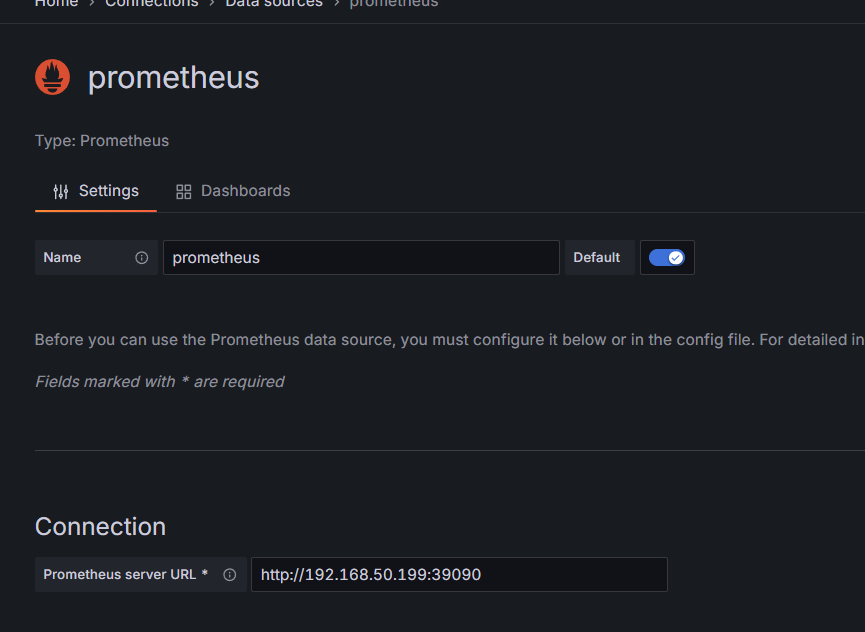
Click on Add new data source in the upper right corner, and select Prometheus.
Since the internal network deployment has not set a password, you only need to fill in the Connection address.
Visualization Configuration
We have already deployed the node_exporter for monitoring server resources, and generally, we focus on:
CPU Usage
Load Average
Memory Usage
Disk I/O
Disk Usage
Network Receive
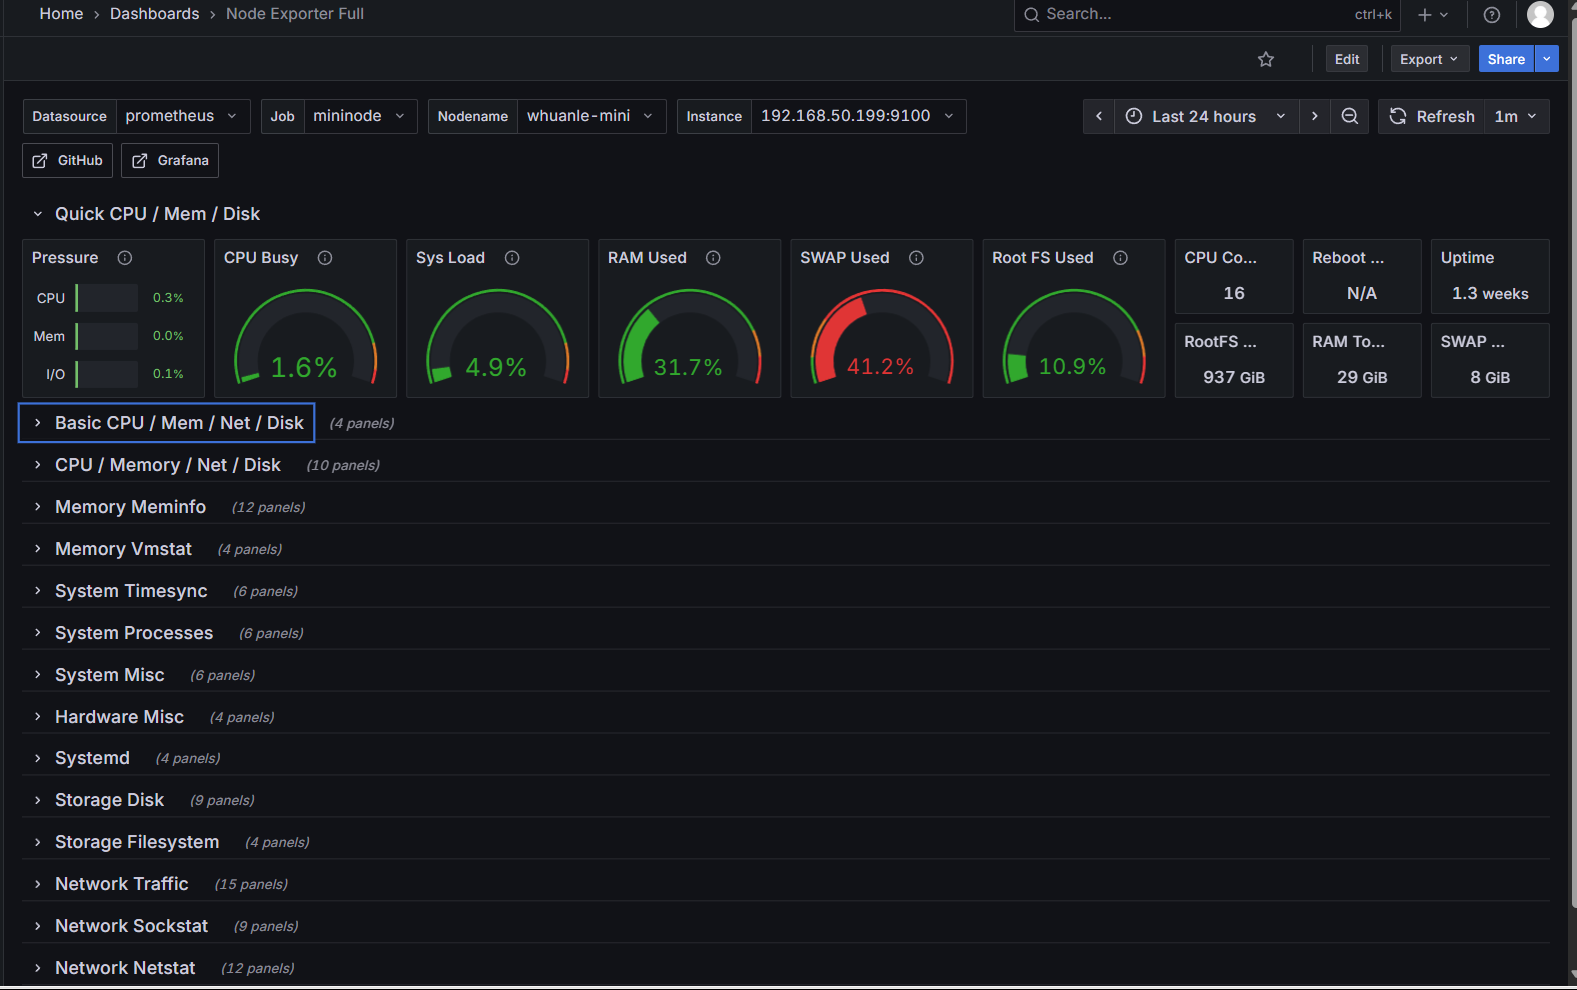
Network TransmitAfter integrating the Prometheus data source, different data sources would require selecting the appropriate panel to display data; for example, this node_exporter template:
https://grafana.com/grafana/dashboards/1860-node-exporter-full/
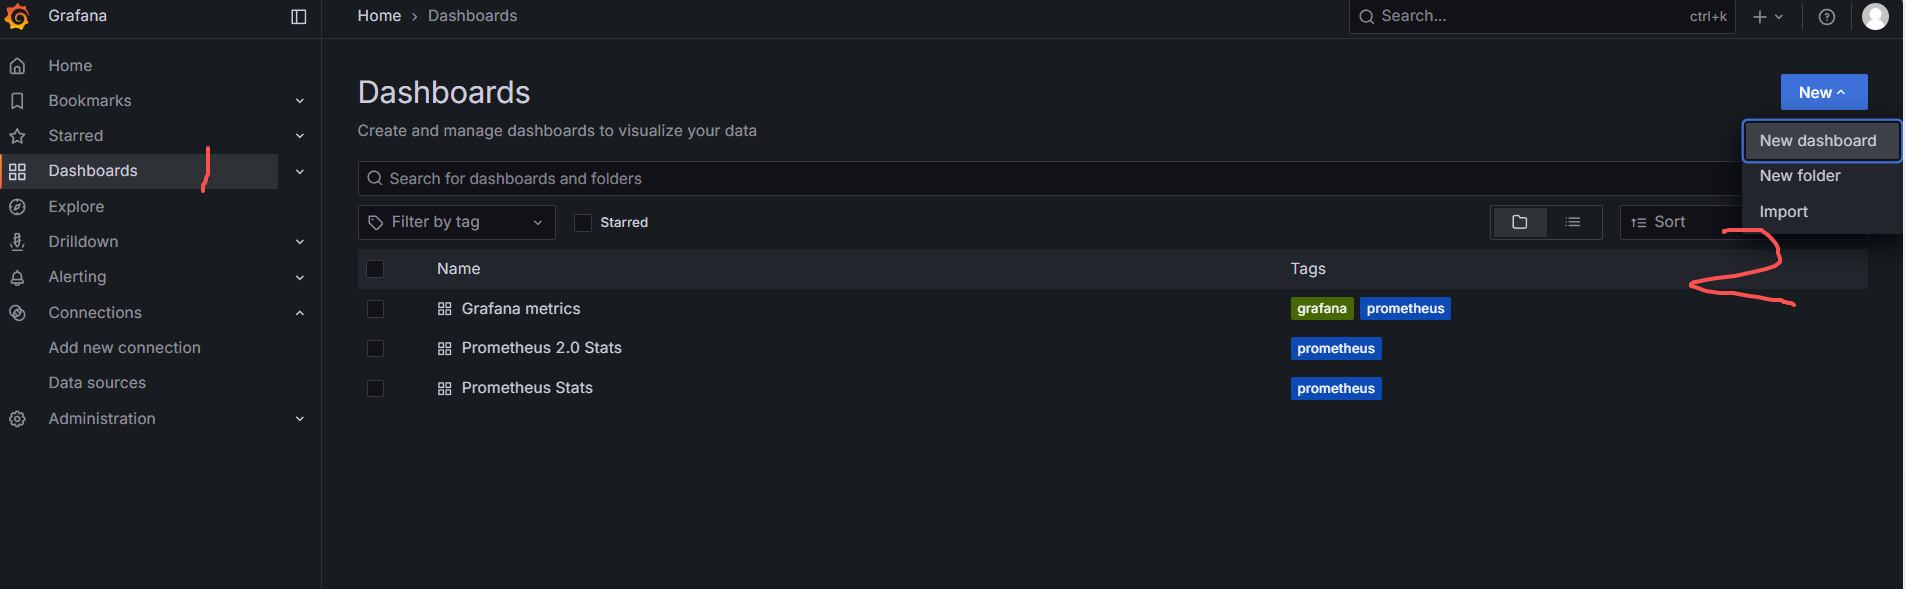
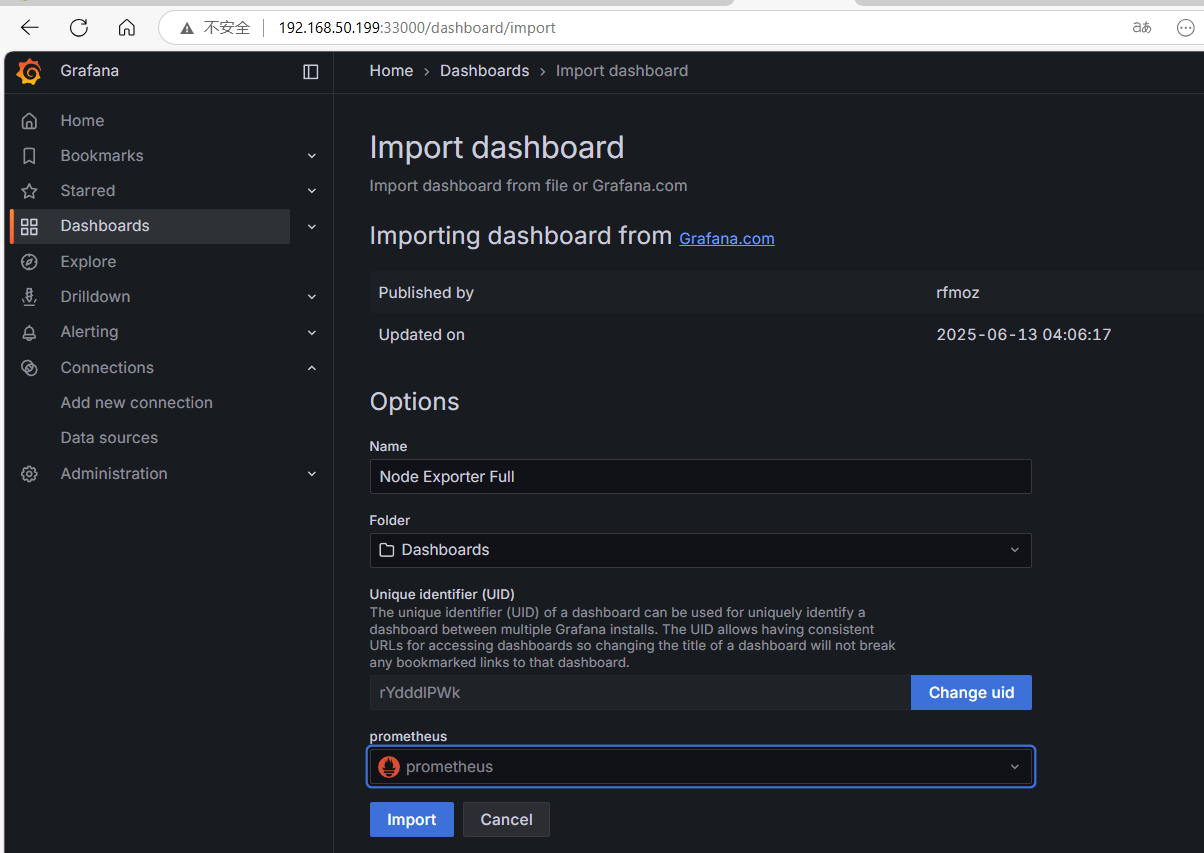
On the template introduction page, copy the ID or download JSON:
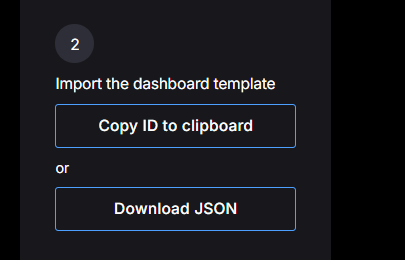
Return to Grafana to import the panel.
After successful import, you can see various data of the nodes.
MySQL Exporter
Used to observe various performance indicators of the MySQL database.
Create an exporter user in MySQL:
CREATE USER 'exporter'@'%' IDENTIFIED BY 'your_password' WITH MAX_USER_CONNECTIONS 3;

# Grant permissions
GRANT PROCESS, REPLICATION CLIENT, SELECT ON *.* TO 'exporter'@'%';
FLUSH PRIVILEGES;
If mysql-exporter cannot function properly after granting permissions, refer to:
-- For MySQL version 8.0.22 and above
GRANT PROCESS, REPLICATION CLIENT, REPLICATION SLAVE MONITOR, SELECT ON *.* TO 'exporter'@'%';

-- For MySQL version below 8.0.22
GRANT PROCESS, REPLICATION CLIENT, REPLICATION SLAVE ADMIN, SELECT ON *.* TO 'exporter'@'%';

FLUSH PRIVILEGES;
If using MariaDB:
# For MariaDB version 10.5 and above
-- Grant SLAVE MONITOR permission (only for monitoring slave status, more refined permissions)
GRANT SLAVE MONITOR ON *.* TO 'exporter'@'%';

# For MariaDB version 10.4 and below
GRANT SUPER ON *.* TO 'exporter'@'%';

FLUSH PRIVILEGES;
Create a my.cnf file in /data/exporter/mysql.
[client]
host=192.168.50.199
port=3306
user=exporter
password=your_password
Start Docker:
docker pull prom/mysqld-exporter

docker run -itd --restart=always -p 9104:9104 \
--name mysqld-exporter \
--volume=/data/exporter/mysql/my.cnf:/etc/mysql/my.cnf:ro prom/mysqld-exporter \
--config.my-cnf=/etc/mysql/my.cnf
Then modify prometheus.yml to add the content:
  - job_name: mysql
    static_configs:
    - targets: ['192.168.50.199:9104']
Finally, we use the official panel https://grafana.com/grafana/dashboards/14057-mysql/
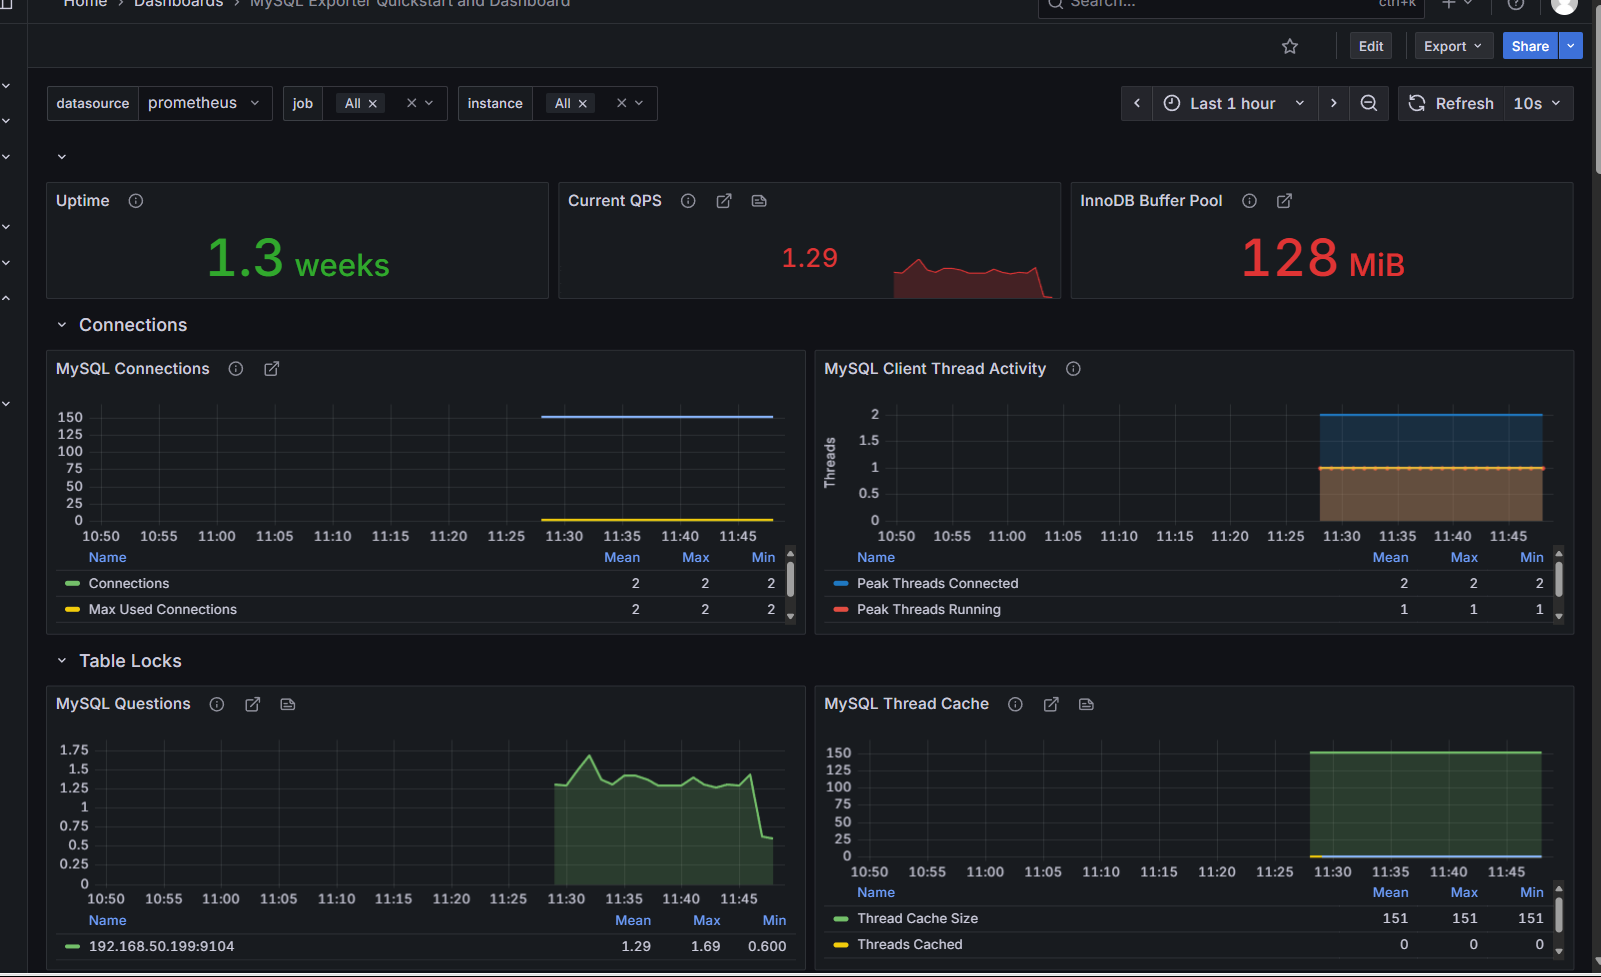
MySQL exporter mostly records:
Uptime
Current QPS
InnoDB Buffer Pool
MySQL Connections
MySQL Client Thread Activity
MySQL Questions
MySQL Thread Cache
MySQL Temporary Objects
MySQL Select Types
MySQL Sorts
MySQL Slow Queries
MySQL Aborted Connections
MySQL Table Locks
MySQL Network Traffic
MySQL Internal Memory Overview
Top Command Counters
MySQL Handlers
MySQL Transaction Handlers
Process States
Top Process States Hourly
MySQL Query Cache Memory
MySQL Query Cache Activity
MySQL File Openings
MySQL Open Files
MySQL Table Open Cache Status
MySQL Open Tables
MySQL Table Definition Cache
Others
The official site has many excellent monitoring libraries: https://prometheus.io/docs/instrumenting/exporters/
Tracing Solution
The commonly used tracing solutions in the community include Jaeger, SkyWalking, Zipkin, etc., each having its pros and cons, which will not be described here one by one.
Tracing primarily consists of storage and UI components; for example, Jaeger supports memory, Cassandra, ElasticSearch, and other methods to store received data, which can then be searched and analyzed via the interface.
With the development of cloud-native architecture, many components offer varying degrees of support for Metrics, Logging, and Tracing. For example, ElasticSearch + Kibana can directly support all three without the need to deploy Prometheus or Grafana separately.
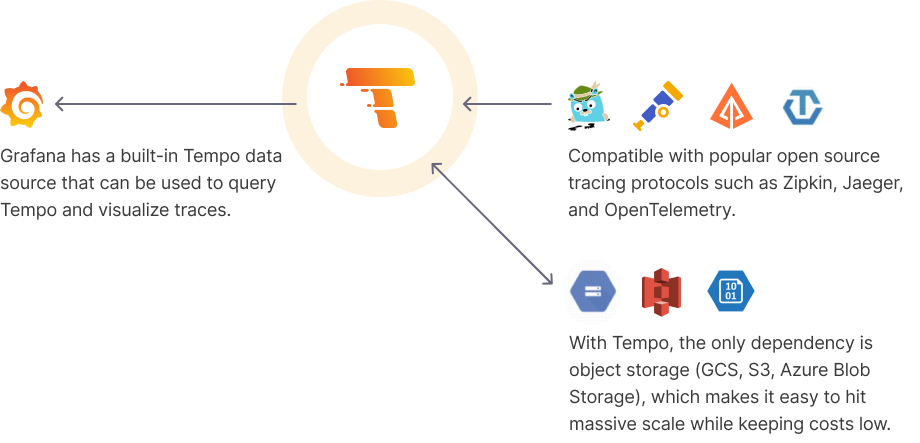
Additionally, Grafana offers Prometheus + Grafana monitoring, Grafana Loki logging, Grafana Tempo for tracing, and many commercial integrated platforms.
Therefore, one should choose a suitable solution based on their specific situation.
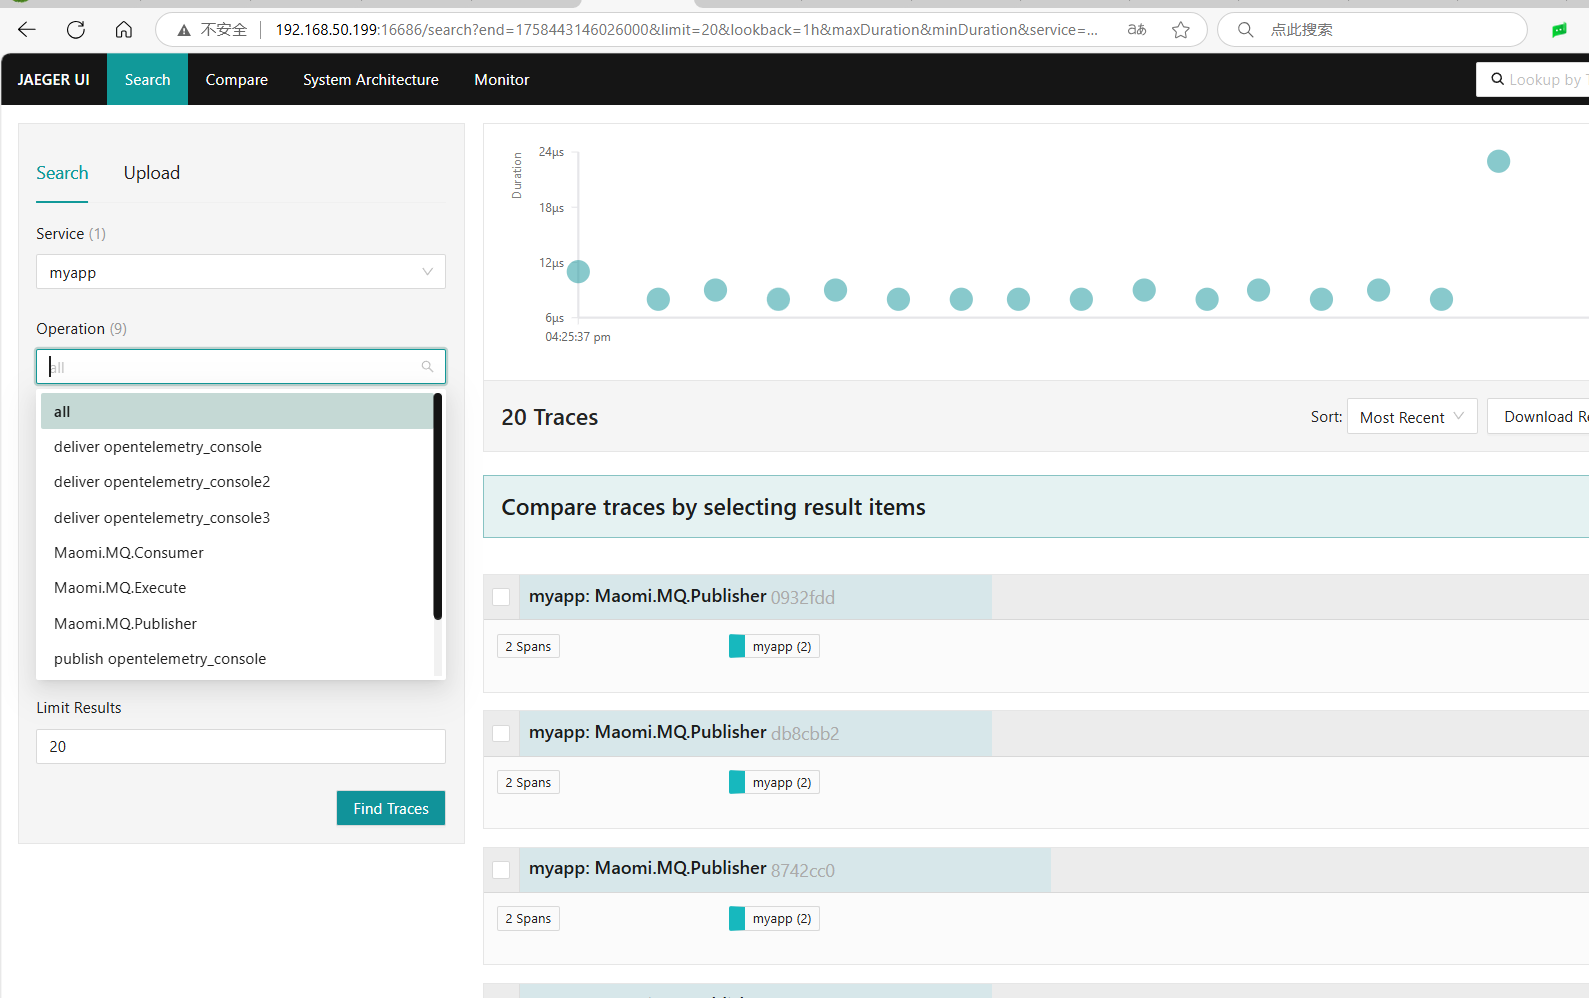
For convenience, we will use Jaeger + ElasticSearch to implement tracing.
Jaeger natively supports receiving data in OpenTelemetry protocol format without needing to deploy the OpenTelemetry Collector, so there is no need for related OpenTelemetry component deployment here.
。
Create the /data/jaeger/jaeger.yml file:
service:
  extensions: [jaeger_storage, jaeger_query]
  pipelines:
    traces:
      receivers: [otlp]
      processors: [batch]
      exporters: [jaeger_storage_exporter]

extensions:
  jaeger_query:
    storage:
      traces: elasticsearch_trace_storage
      metrics: elasticsearch_trace_storage
  jaeger_storage:
    backends:
      elasticsearch_trace_storage: &elasticsearch_config
        elasticsearch:
          server_urls:
            - http://192.168.50.199:9200
          username: elastic
          password: "your-password"
          # Index configuration
          index_prefix: jaeger
          # Index lifecycle management
          use_ilm: true
          ilm:
            policy_name: jaeger-ilm-policy
            rollover_alias: jaeger-span
            pattern: "{now/d}-000001"
            max_age: 7d  # Data retention for 7 days
          # Bulk write configuration
          bulk_size: 1000
          flush_interval: 5s
    metric_backends:
      elasticsearch_trace_storage: *elasticsearch_config

receivers:
  otlp:
    protocols:
      grpc:
        endpoint: "0.0.0.0:4317"
      http:
        endpoint: "0.0.0.0:4318"

processors:
  batch:
    timeout: 10s
    send_batch_size: 1024

exporters:
  jaeger_storage_exporter:
    trace_storage: elasticsearch_trace_storage
Start Jaeger:
docker run -d \
  --name jaeger \
  -p 4317:4317 \
  -p 4318:4318 \
  -p 5775:5775/udp \
  -p 6831:6831/udp \
  -p 6832:6832/udp \
  -p 5778:5778 \
  -p 16686:16686 \
  -p 14268:14268 \
  -p 14250:14250 \
-v /data/jaeger/jaeger.yml:/etc/jaeger/jaeger.yml \
  jaegertracing/all-in-one:latest \
  --config-file=/etc/jaeger/jaeger.yml
The following is a detailed explanation of the commonly used ports for the Jaeger components and their purposes:
| Port Number | Protocol | Component / Purpose | Detailed Explanation |
|---|---|---|---|
| 5775 | UDP | Agent (Zipkin) | Receives data in Zipkin compatible Thrift protocol (rarely used) |
| 6831 | UDP | Agent (Jaeger Thrift) | Receives tracing data sent by the Jaeger native client using compact encoding format |
| 6832 | UDP | Agent (Jaeger Thrift) | Receives tracing data sent by the Jaeger native client using binary encoding format |
| 5778 | TCP | Agent/Health Check | Provides the agent's configuration interface and health check endpoint (can get sampling policy, etc.) |
| 16686 | TCP | Query Service (UI) | Jaeger Web UI access port, accessible via browser to view tracing data |
| 14268 | TCP | Collector (Jaeger Thrift) | Receives tracing data sent directly by the Jaeger native client (used when not going through Agent) |
| 14250 | TCP | Collector (gRPC) | Receives Jaeger format data sent via gRPC protocol |
| 4317 | TCP | Collector (OTLP gRPC) | Receives tracing data sent by OpenTelemetry clients via gRPC protocol (OTLP standard port) |
| 4318 | TCP | Collector (OTLP HTTP) | Receives tracing data sent by OpenTelemetry clients via HTTP protocol (OTLP standard port) |
| 9411 | TCP | Collector (Zipkin) | Reception port compatible with Zipkin protocol for receiving data sent by Zipkin clients (optional to enable) |
Access the UI via port 16686.
If needed, you can start a task to move tracing data older than a certain duration to another index.
docker run -it --rm --net=host \
  -e CONDITIONS='{"max_age": "2d"}' \
  -e ES_USERNAME=elastic \
  -e ES_PASSWORD=your-password \
  jaegertracing/jaeger-es-rollover:latest \
  rollover  http://localhost:9200
If necessary, you can start a task to delete data that has been around for too long.
docker run -it --rm --net=host \
  -e UNIT=days -e UNIT_COUNT=7 \
  -e ES_USERNAME=elastic \
  -e ES_PASSWORD=your-password \
  jaegertracing/jaeger-es-rollover:latest \
  lookback http://localhost:9200
Integrate OpenTelemetry
With the development of OpenTelemetry, it has provided full support for Metrics and Logging, unifying the collection through the Opentelemetry Collector and forwarding it to different backends. The Collector itself does not store data; it is a collector.
However, in practice, it is mainly used as a collector for tracing and monitoring, rarely as a logging collector.
The ports exposed by Opentelemetry are as follows:
  ports:
    - 1888:1888 # pprof extension
    - 8888:8888 # Prometheus metrics exposed by the Collector
    - 8889:8889 # Prometheus exporter metrics
    - 13133:13133 # health_check extension
    - 4317:4317 # OTLP gRPC receiver
    - 4318:4318 # OTLP http receiver
    - 55679:55679 # zpages extension
The Opentelemetry Collector has corresponding addresses exposed for collecting different content, such as /v1/traces for tracing and /v1/metrics for monitoring.
Reference C# code:
builder.Services.AddOpenTelemetry()
.ConfigureResource(resource => resource.AddService(serviceName))
.WithTracing(tracing =>
{
.AddAspNetCoreInstrumentation()
.AddOtlpExporter(options =>
{
options.Endpoint = new Uri("http://192.168.50.199:4318" + "/v1/traces");
options.Protocol = OtlpExportProtocol.HttpProtobuf;
});
})
.WithMetrics(metrices =>
{
metrices.AddAspNetCoreInstrumentation()
.AddOtlpExporter(options =>
{
options.Endpoint = new Uri("http://192.168.50.199:4318" + "/v1/metrics");
options.Protocol = OtlpExportProtocol.HttpProtobuf;
});
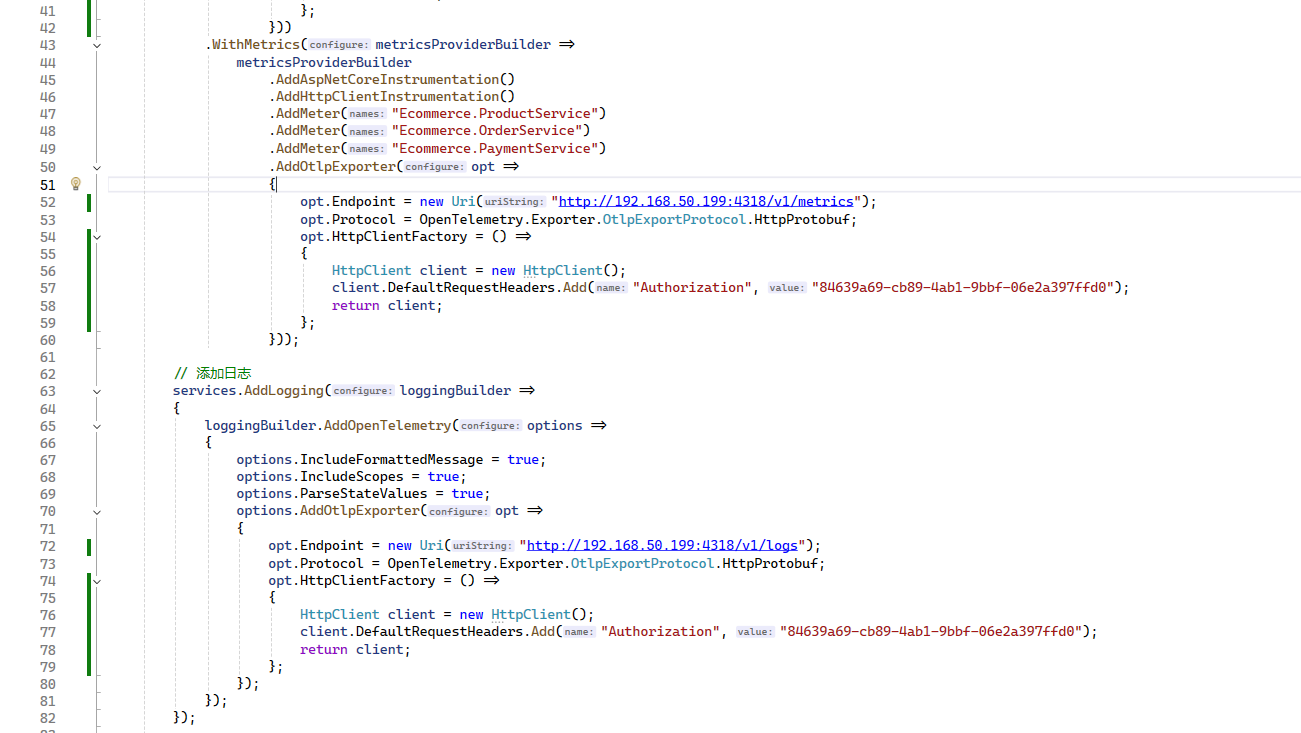
});Here, we use the OpenTelemetry Collector as a unified access layer for tracing and monitoring, mainly targeting backend services, meaning backend services uniformly connect to the OpenTelemetry Collector to push content. The OpenTelemetry Collector then pushes tracing and monitoring data to Jaeger and Prometheus.
Pull the OpenTelemetry Collector image.
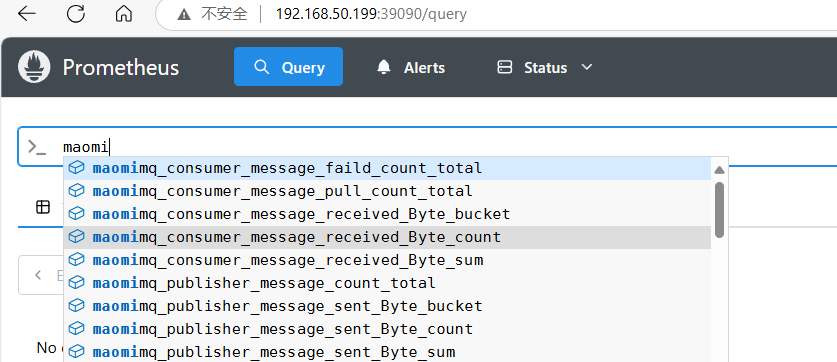
docker pull otel/opentelemetry-collector-contrib:0.135.0By default, Prometheus does not enable write functionality. You need to add the --web.enable-remote-write-receiver environment variable to enable writing, and also support using --web.enable-otlp-receiver to enable OTLP for /api/v1/otlp/v1/metrics to receive monitoring data.
However, the official website notes that both methods are not efficient, but the products offered by Alibaba Cloud use --web.enable-remote-write-receiver.
There are two methods to receive metrics from the Opentelemetry Collector. One is to delete the Prometheus container and start it with a new command:
docker run -itd --restart=always -p 9090:9090 \
-v /data/prometheus/config/prometheus.yml:/etc/prometheus/prometheus.yml \
-v /data/prometheus/data:/prometheus \
prom/prometheus --web.enable-remote-write-receiver
The other method is to push to a pushgateway, then Prometheus collects from the pushgateway. The following method adopts this approach.
Create a new configuration file at /data/opentelemetry/config.yaml:
receivers:
  # Keep only the OTLP receiver (receives OTLP format data pushed by application)
  otlp:
    protocols:
      grpc:
        endpoint: "0.0.0.0:4317"  # Receives OTLP gRPC protocol data
      http:
        endpoint: "0.0.0.0:4318"  # Receives OTLP HTTP protocol data

processors:
  # Batch processing (reduce network request count, improve efficiency)
  batch:
    timeout: 10s
    send_batch_size: 1024

  # Resource attribute enhancement (add labels like environment, cluster, etc.)
  resource:
    attributes:
      - key: "env"
        value: "production"
        action: upsert
      - key: "cluster"
        value: "k8s-cluster-01"
        action: upsert

exporters:
  # Export tracing data to Jaeger (via OTLP HTTP protocol)
  otlphttp/jaeger:
    endpoint: "http://192.168.50.199:4318"
    tls:
      insecure: true

  # Export metrics data to Prometheus (via remote_write protocol)
  prometheusremotewrite:
    endpoint: "http://192.168.50.199:9090/api/v1/write"
    tls:
      insecure: true
    headers:
      X-Prometheus-Remote-Write-Version: "0.1.0"

  # Optional: Expose Prometheus format metrics locally (for debugging or temporary scraping)
  prometheus:
    endpoint: "0.0.0.0:8889"
    const_labels:
      source: "otel-collector"

service:
  telemetry:
    logs:
      level: debug  # Debug log level, can change to info in production
  pipelines:
    # Tracing data processing pipeline
    traces:
      receivers: [otlp]  # Only receive OTLP tracing data
      processors: [batch, resource]  # Batch processing + resource enhancement
      exporters: [otlphttp/jaeger]  # Export to Jaeger

    # Metrics data processing pipeline
    metrics:
      receivers: [otlp]  # Only receive OTLP metrics data
      processors: [batch, resource]  # Batch processing + resource enhancement
      exporters: [prometheusremotewrite, prometheus]  # Export to Prometheus and local endpoint
If you want the Collector to scrape instead of using Prometheus to scrape, you can add the prometheus configuration, referring to:
receivers:
  # Keep only the OTLP receiver (receives OTLP format data pushed by application)
  otlp:
    protocols:
      grpc:
        endpoint: "0.0.0.0:4317"  # Receives OTLP gRPC protocol data
      http:
        endpoint: "0.0.0.0:4318"  # Receives OTLP HTTP protocol data

  prometheus:
    config:
      scrape_configs:
        - job_name: "otel-collector-self"
          scrape_interval: 10s
          static_configs:
            - targets: ["localhost:8888"]
        - job_name: "your-app"
          scrape_interval: 15s
          static_configs:
            - targets: ["app-service:8080"]

  # Correction: prometheusremotewrite receiver only needs to configure the port, path is not required
  prometheusremotewrite:
    endpoint: "0.0.0.0:9090"  # Removed /api/v1/write path
... omitted ...
http://192.168.50.199:9091/api/v1/writeis the address of the pushgateway.
Start the opentelemetry-collector-contrib:
docker run -itd \
--name=otelcol \
--restart=always \
-p 1888:1888 \
-p 8888:8888 \
-p 8889:8889 \
-p 13133:13133 \
-p 4317:4317 \
-p 4318:4318 \
-p 55679:55679 \
-v /data/opentelemetry/config.yaml:/etc/otelcol-contrib/config.yaml \
otel/opentelemetry-collector-contrib:0.135.0
Since the Opentelemetry Collector conflicts with Jaeger in terms of ports, readers need to adjust the mapped ports 4317 and 4318.
Grafana Family
This section explores the Grafana Prometheus, Grafana Loki, and Grafana Tempo family solutions.
Metrics Solution
In the previous section, monitoring data was pushed to Prometheus through the Opentelemetry Collector, which is a recommended practice.
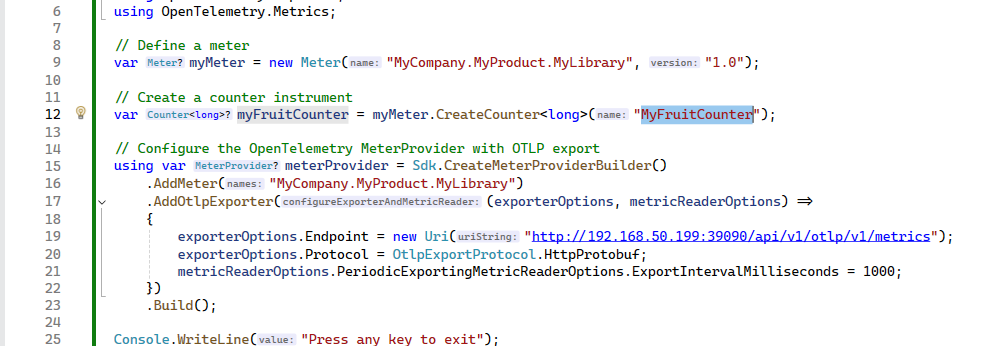
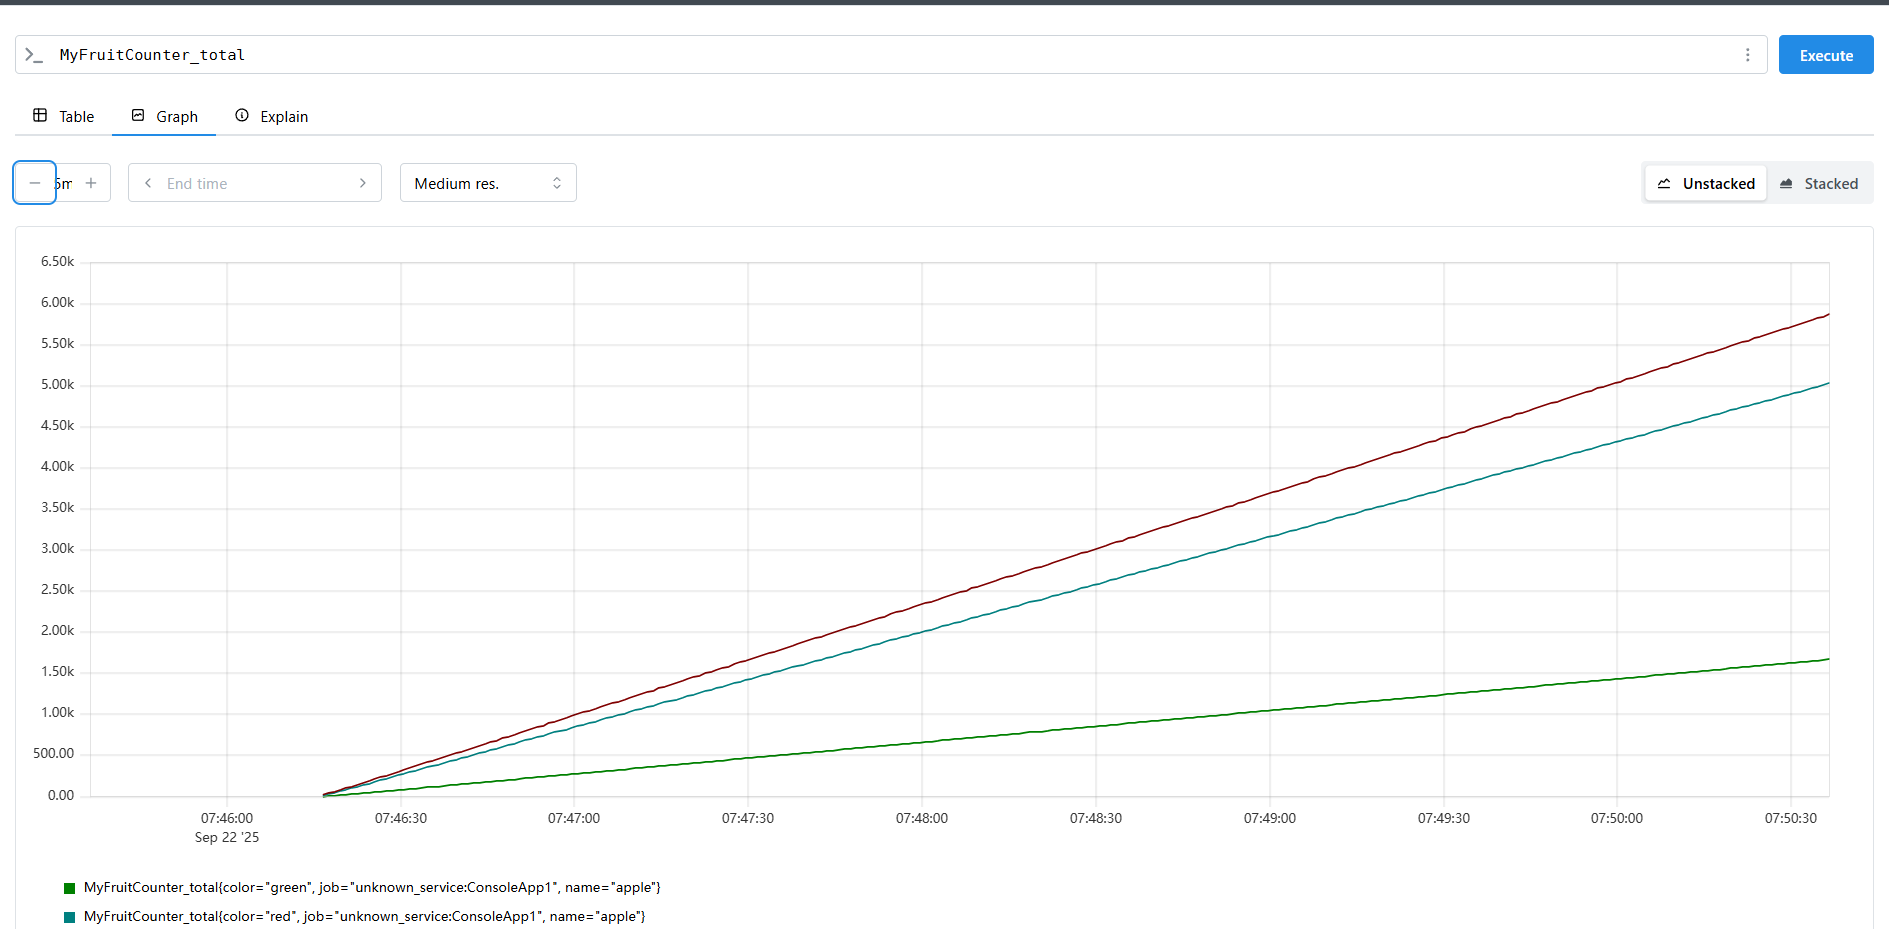
Of course, Prometheus can also directly provide functionality compatible with the Collector interface and need to enable /v1/metrics to be compatible with OpenTelemetry by using --web.enable-otlp-receiver to enable the OTLP receiving monitoring data on /api/v1/otlp/v1/metrics.
docker run    -itd --restart=always  -p 9090:9090         \
-v /data/prometheus/config/prometheus.yml:/prometheus/prometheus.yml     \
-v /data/prometheus/data:/prometheus     \
prom/prometheus \
--web.enable-remote-write-receiver \
--web.enable-otlp-receiver
C# code reference: https://opentelemetry.io/docs/languages/dotnet/metrics/getting-started-prometheus-grafana/
However, it is still recommended to use the Opentelemetry Collector first for forwarding.
The application only needs to standardize the interface with the Collector, and the specific backend can be handled flexibly by operations. In case a certain solution does not meet growth demands in the future, only the Collector configuration needs to be replaced, and the backend service does not require code or configuration changes.
Logging Solution
Loki supports horizontal scaling on Kubernetes, but since the author uses a home server, a single Docker deployment is sufficient for daily log reads and writes of about 20GB.
The resource usage of Loki logs mainly depends on the amount of logs consumed. According to the official documentation, ingesting 1 MiB of logs per second is expected to use about:
- 1 CPU core
- 120 MiB of memory
Grafana has Alloy to support collecting logs from the host, containers, and Kubernetes clusters, but out of habit, we continue to use the original Filebeat and Kafka log collection solution.
The author notes that the Loki solution is not very mature; its throughput is lower than that of ElasticSearch. When the amount pushed by Grafana Alloy increases, Loki returns 429.
Create directories /data/loki/config and /data/loki/data, then execute the command in the /data/loki/config directory to download the configuration file.
wget https://raw.githubusercontent.com/grafana/loki/v3.4.1/cmd/loki/loki-local-config.yaml -O loki-config.yamlThe configuration file specifies the use of TSDB:
schema_config:
  configs:
    - from: 2020-10-24
      store: tsdb
      object_store: filesystem
Modify the config.yaml file to configure the TSDB storage directory mapping to the host to achieve persistence:
auth_enabled: false

server:
  http_listen_port: 3100
  grpc_listen_port: 9096
  log_level: debug
  grpc_server_max_concurrent_streams: 1000

common:
  instance_addr: 192.168.50.199
  path_prefix: /var/lib/loki  # Change to a non-temporary directory
  storage:
    filesystem:
      chunks_directory: /var/lib/loki/chunks
      rules_directory: /var/lib/loki/rules
  replication_factor: 1
  # Standalone deployment; cluster deployment requires using consul
  ring:
    kvstore:
      store: inmemory

query_range:
  results_cache:
    cache:
      embedded_cache:
        enabled: true
        max_size_mb: 100

limits_config:
  metric_aggregation_enabled: true

schema_config:
  configs:
    - from: 2020-10-24
      store: tsdb
      object_store: filesystem
      schema: v13
      index:
        prefix: index_
        period: 24h

pattern_ingester:
  enabled: true
  metric_aggregation:
    loki_address: 192.168.50.199:3100

ruler:
  alertmanager_url: http://192.168.50.199:9093

frontend:
  encoding: protobuf
Start the Loki service:
docker run --name loki -itd --restart=always \
-v /data/loki/config:/mnt/config \
-v /data/loki/data:/var/lib/loki \
-p 3100:3100 \
-p 9096:9096 \
grafana/loki:3.4.1 \
-config.file=/mnt/config/loki-config.yaml
After deploying Loki, two more tasks are needed: one is to monitor Loki using Prometheus at http://:3100/metrics, and the other is to use Alloy to consume Kafka logs and push them to Loki.
Modify the prometheus.yml file, add the configuration, and restart the Prometheus container.
  - job_name: loki
    static_configs:
    - targets: ['192.168.50.199:3100']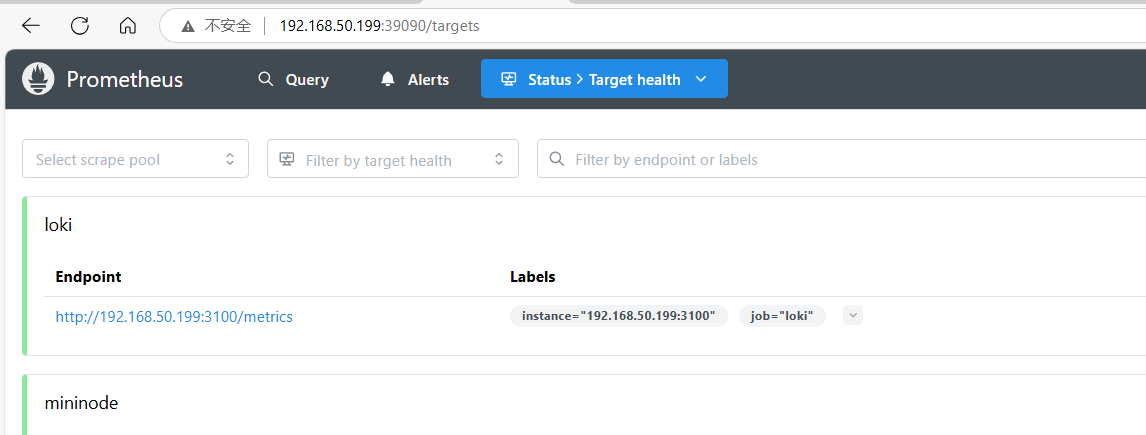
To push logstash data to Loki, plugins need to be installed. However, Loki is not officially recommended for this use; the official recommendation is to use Grafana Alloy or to integrate OpenTelemetry.
Since the configuration for pushing from Logstash to Loki is quite complicated, it will not be used here.
Readers can refer to: https://grafana.org.cn/docs/loki/latest/send-data/logstash/
Grafana Alloy is the officially recommended component for log collection, with functions similar to Filebeat and Logstash.
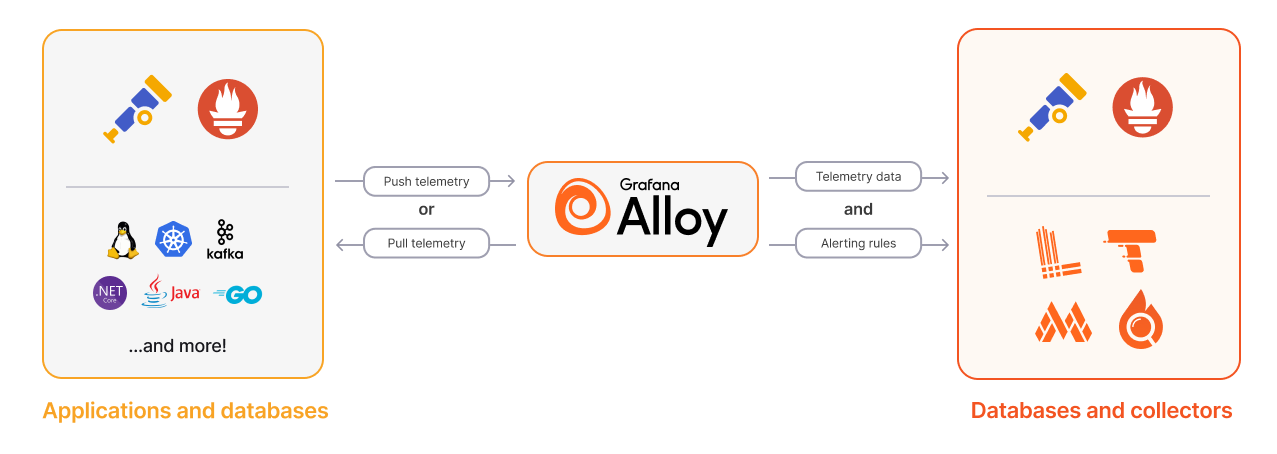
Image from Grafana official documentation.
Alloy pipelines are built from components that perform specific functions. For logs, these components can be divided into three categories:
- Collectors: These components collect/receive logs from various sources. This includes fetching logs from files, receiving logs via HTTP or gRPC, or collecting logs from message queues.
- Transformers: These components process logs before sending them to writers. For example, additional metadata can be added, logs can be filtered, or logs can be batched before being sent.
- Writers: These components send logs to the target destination. The focus is on how logs are sent to Loki, but Alloy supports sending logs to various destinations.
Alloy can collect logs pushed to Kafka by Filebeat, transform them, and then push them to Loki. Alternatively, Alloy can directly collect logs from Docker and the host. However, since Filebeat is already in use, we will not complicate the collection step and will instead use Alloy to replace Logstash.
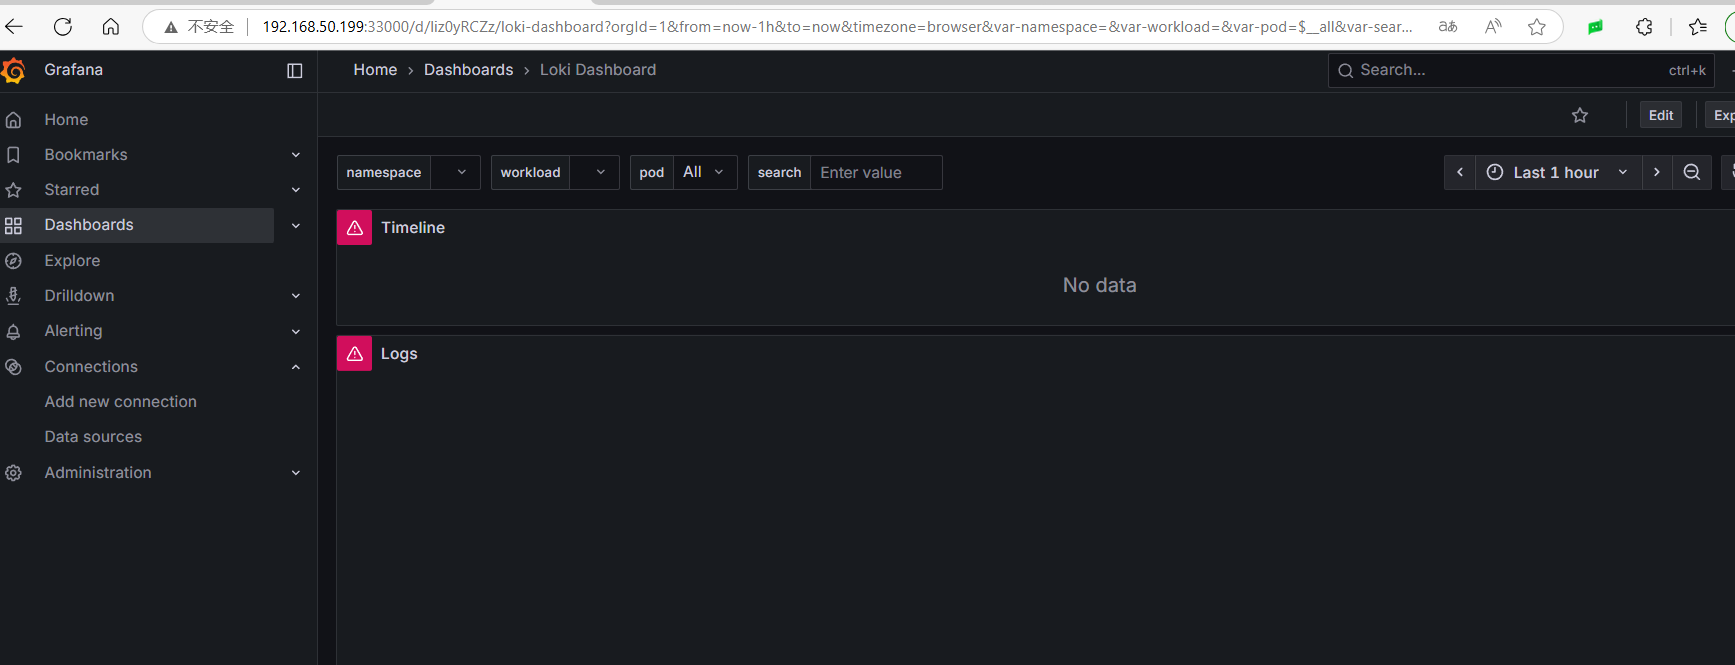
Grafana Loki
After deploying Loki, you need to display it in Grafana by adding a data source.
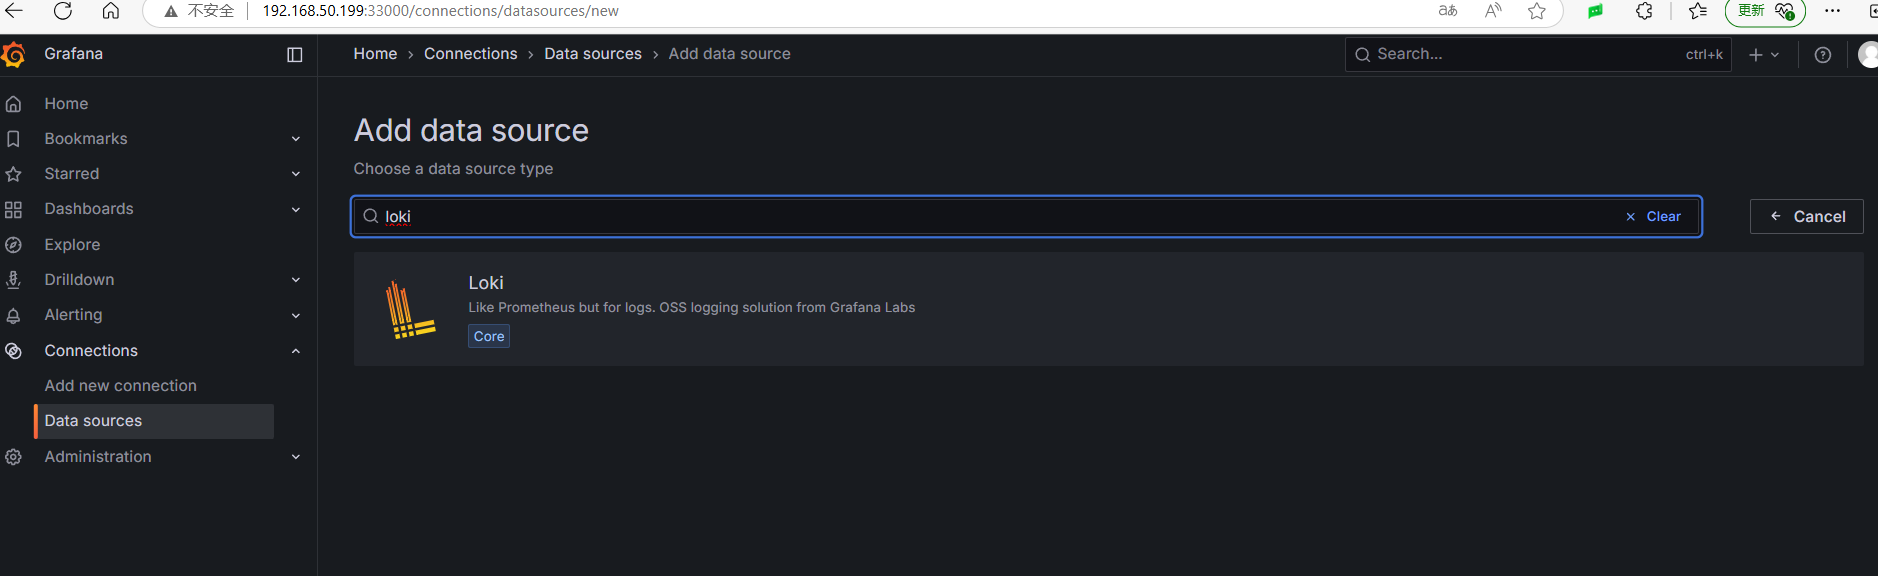
Then use the 13186 template to display Loki logs: https://grafana.com/grafana/dashboards/13186-loki-dashboard/
Filebeat + Kafka + Alloy
Create the /data/alloy/data directory, and create the config.alloy file in the /data/alloy/config directory:
loki.source.kafka "local" {
  brokers                = ["192.168.50.199:9092"]
  topics                 = ["docker-logs"]
  labels                 = {component = "loki.source.kafka"}
  forward_to             = [loki.process.add_labels.receiver]
  use_incoming_timestamp = true
  relabel_rules          = loki.relabel.kafka.rules
}

loki.process "add_labels" {
  // Parse JSON message content, extract container.name, host.name, etc.
  stage.json {
    expressions = {
      container_name = "container.name",
      host_name      = "host.name",
      image_name     = "container.image.name",
    }
  }
  // Use extracted fields as labels
  stage.labels {
    values = {
      container = "container_name",
      host      = "host_name",
      image     = "image_name",
    }
  }
  forward_to = [loki.write.local.receiver]
}

loki.relabel "kafka" {
  forward_to = [loki.write.local.receiver]
  rule {
    source_labels = ["__meta_kafka_topic"]
    target_label  = "topic"
  }
}

loki.write "local" {
  endpoint {
    url = "http://192.168.50.199:3100/loki/api/v1/push"
  }
}
Start Alloy:
docker run -itd --restart=always \
-v /data/alloy/config/config.alloy:/etc/alloy/config.alloy \
-v /data/alloy/data:/var/lib/alloy/data \
-p 12345:12345 \
grafana/alloy:latest \
run --server.http.listen-addr=0.0.0.0:12345 --storage.path=/var/lib/alloy/data \
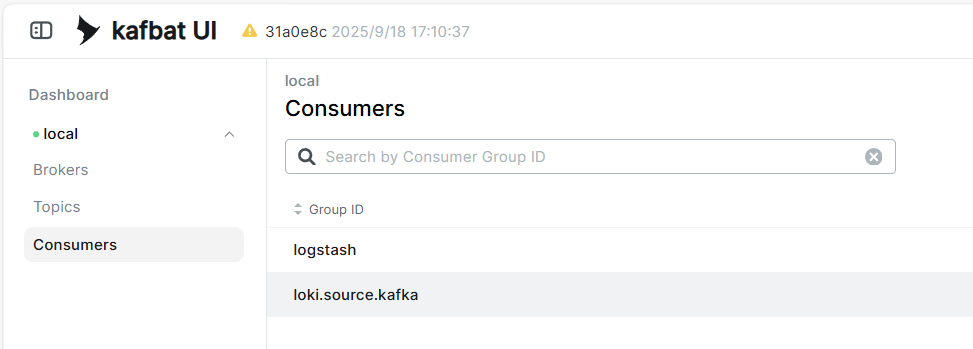
/etc/alloy/config.alloyRestart Loki, and you will see an additional consumer in Kafka:
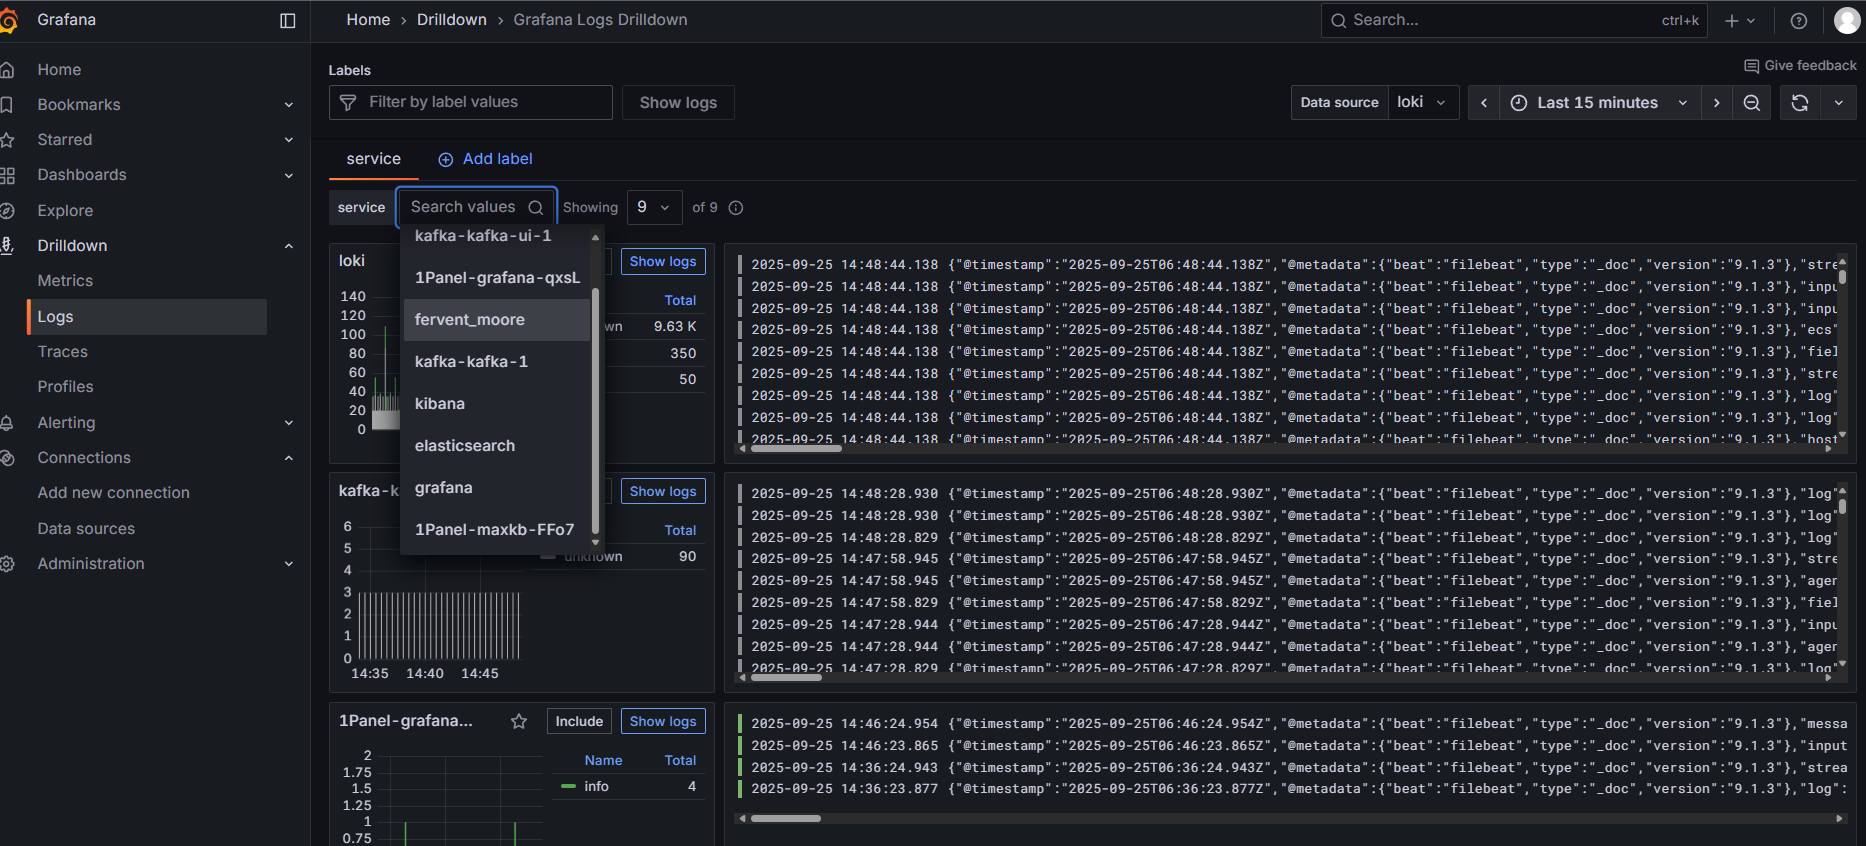
In Grafana under Drilldown/Logs, you can see the collected logs.
There is too little information on Alloy, making customization difficult. For example, after consuming messages from Kafka's docker-logs topic, labels must be added to the messages to filter corresponding container logs. The author spent two days and tried various tools but eventually found a solution through documentation. Production-level usage demands can be quite complex, and configuring with Alloy can consume significant time. Moreover, Loki's throughput seems lower than that of ElasticSearch. Therefore, it is still recommended to adopt the ElasticSearch storage solution.
Loki's throughput may not be high; when Alloy consumes large amounts and pushes to Loki, it can get rejected.
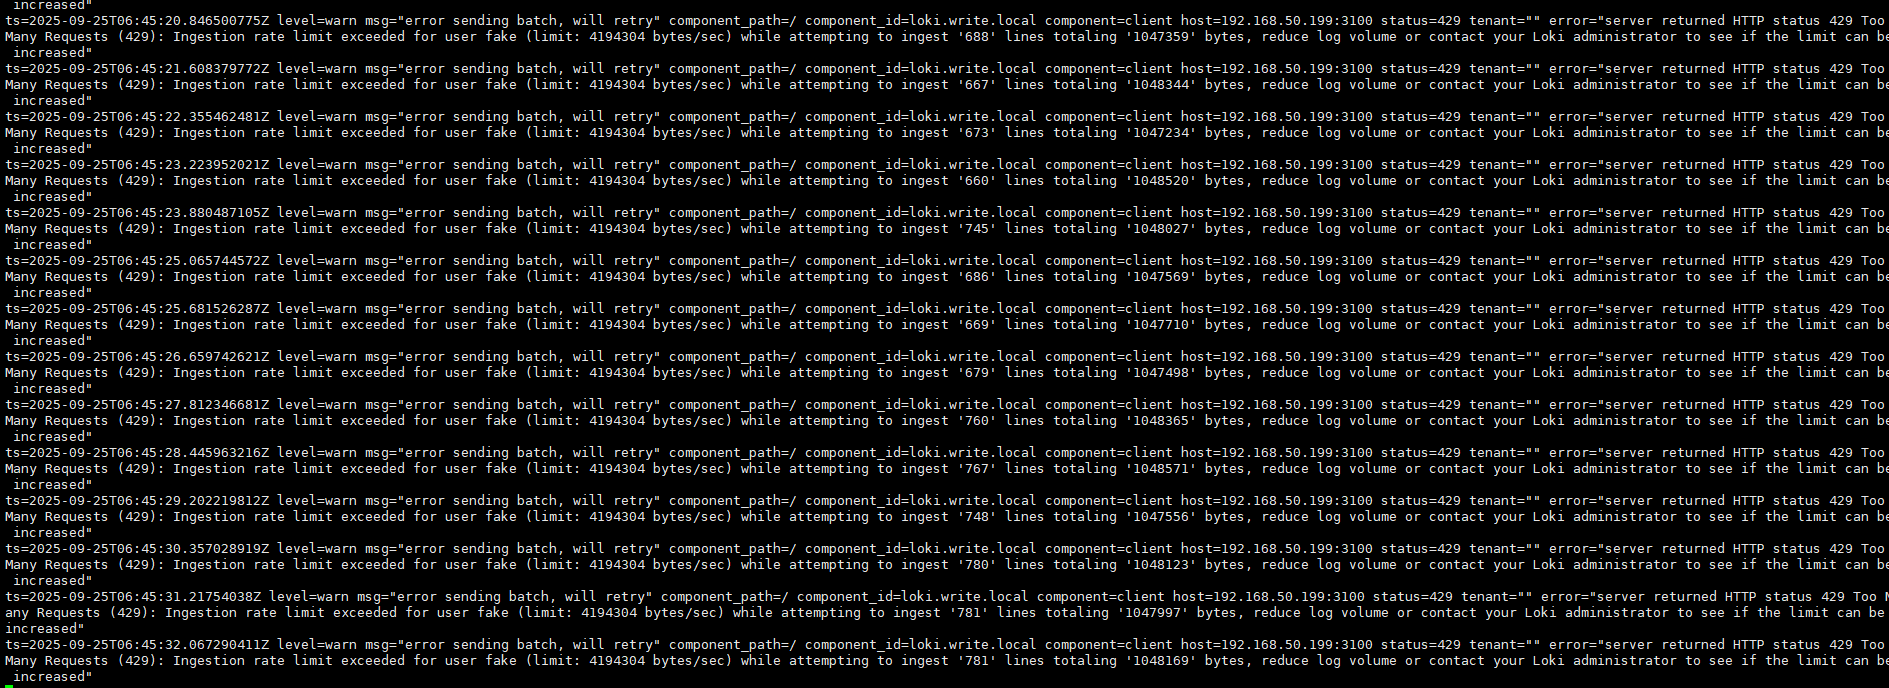
Thus, the author does not recommend using Loki as a log storage backend to avoid the hassle.
Tracing Solution
Tempo is quite worth using and can easily handle the data volume of small to medium-sized companies. Coupled with Grafana's UI, it is quite convenient to use.
Tempo primarily uses OSS for data storage and utilizes memcached to accelerate the filtering and querying speed of trace IDs. However, it seems that once the data volume becomes very large, querying OSS can become challenging and slow, possibly requiring maintainers to adjust various compression configurations.
Tempo has many configuration options related to compression, storage, searching etc., and maintainers must pay attention to how to reasonably configure data and data volume for different tasks.
Clone the Tempo repository:
git clone https://github.com/grafana/tempo.gitHere we only use the official
tempo.yamlfile. If cloning the repository, you may only need to download https://github.com/grafana/tempo/blob/main/example/docker-compose/local/tempo.yaml
Create the /data/tempo/data directory and a docker-compose.yaml file in /data/tempo/:
services:
  init:
    image: &tempoImage grafana/tempo:latest
    user: root
    entrypoint:
      - "chown"
      - "10001:10001"
      - "/var/tempo"
    volumes:
      - /data/tempo/data:/var/tempo

  memcached:
    image: memcached:1.6.38
    container_name: memcached
    ports:
      - "11211:11211"
    environment:
      - MEMCACHED_MAX_MEMORY=64m  # Set the maximum memory usage
      - MEMCACHED_THREADS=4       # Number of threads to use

  tempo:
    image: *tempoImage
    command: [ "-config.file=/etc/tempo.yaml" ]
    volumes:
      - /data/tempo/tempo.yaml:/etc/tempo.yaml
      - /data/tempo/data:/var/tempo
    ports:
      - "14268:14268"  # jaeger ingest
      - "3200:3200"   # tempo
      - "9095:9095" # tempo grpc
      - "4317:4317"  # otlp grpc
      - "4318:4318"  # otlp http
      - "9411:9411"   # zipkin
    depends_on:
      - init
      - memcached

  k6-tracing:
    image: ghcr.io/grafana/xk6-client-tracing:v0.0.7
    environment:
      - ENDPOINT=tempo:4317
    restart: always
    depends_on:
      - tempo
k6-tracingis a program that simulates the generation of trace information, and it can be omitted.Memcached caching is mainly used to enhance query performance by accessing a Bloom filter that stores all backend blocks during each query.
Since the tempo service startup ports conflict with Jaeger and the OpenTelemetry Collector, these must be stopped first.
Modify the tempo.yaml file, copy it to /data/tempo/tempo.yaml, and replace the Prometheus address:
If looking for it in the git repository, the location is at
example/docker-compose/local/tempo.yaml.
storage:
path: /var/tempo/generator/wal
remote_write:
- url: http://192.168.50.199:9090/api/v1/write
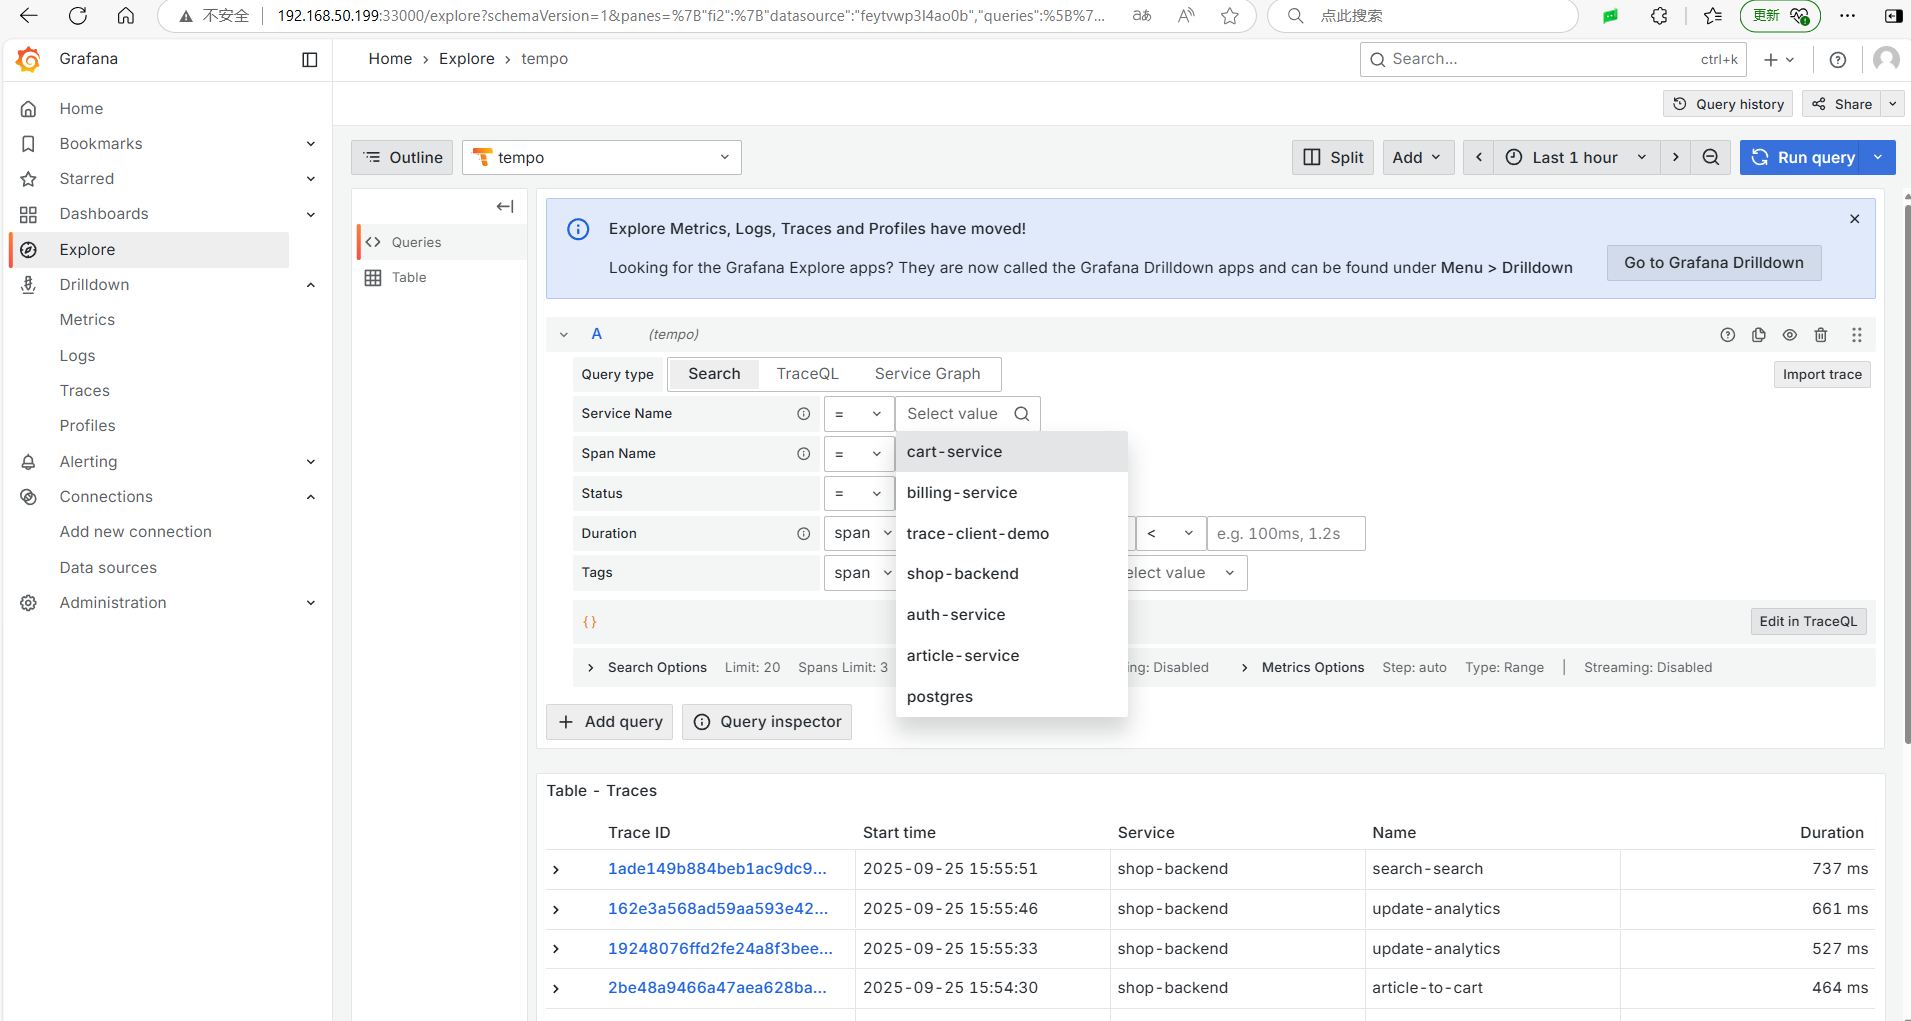
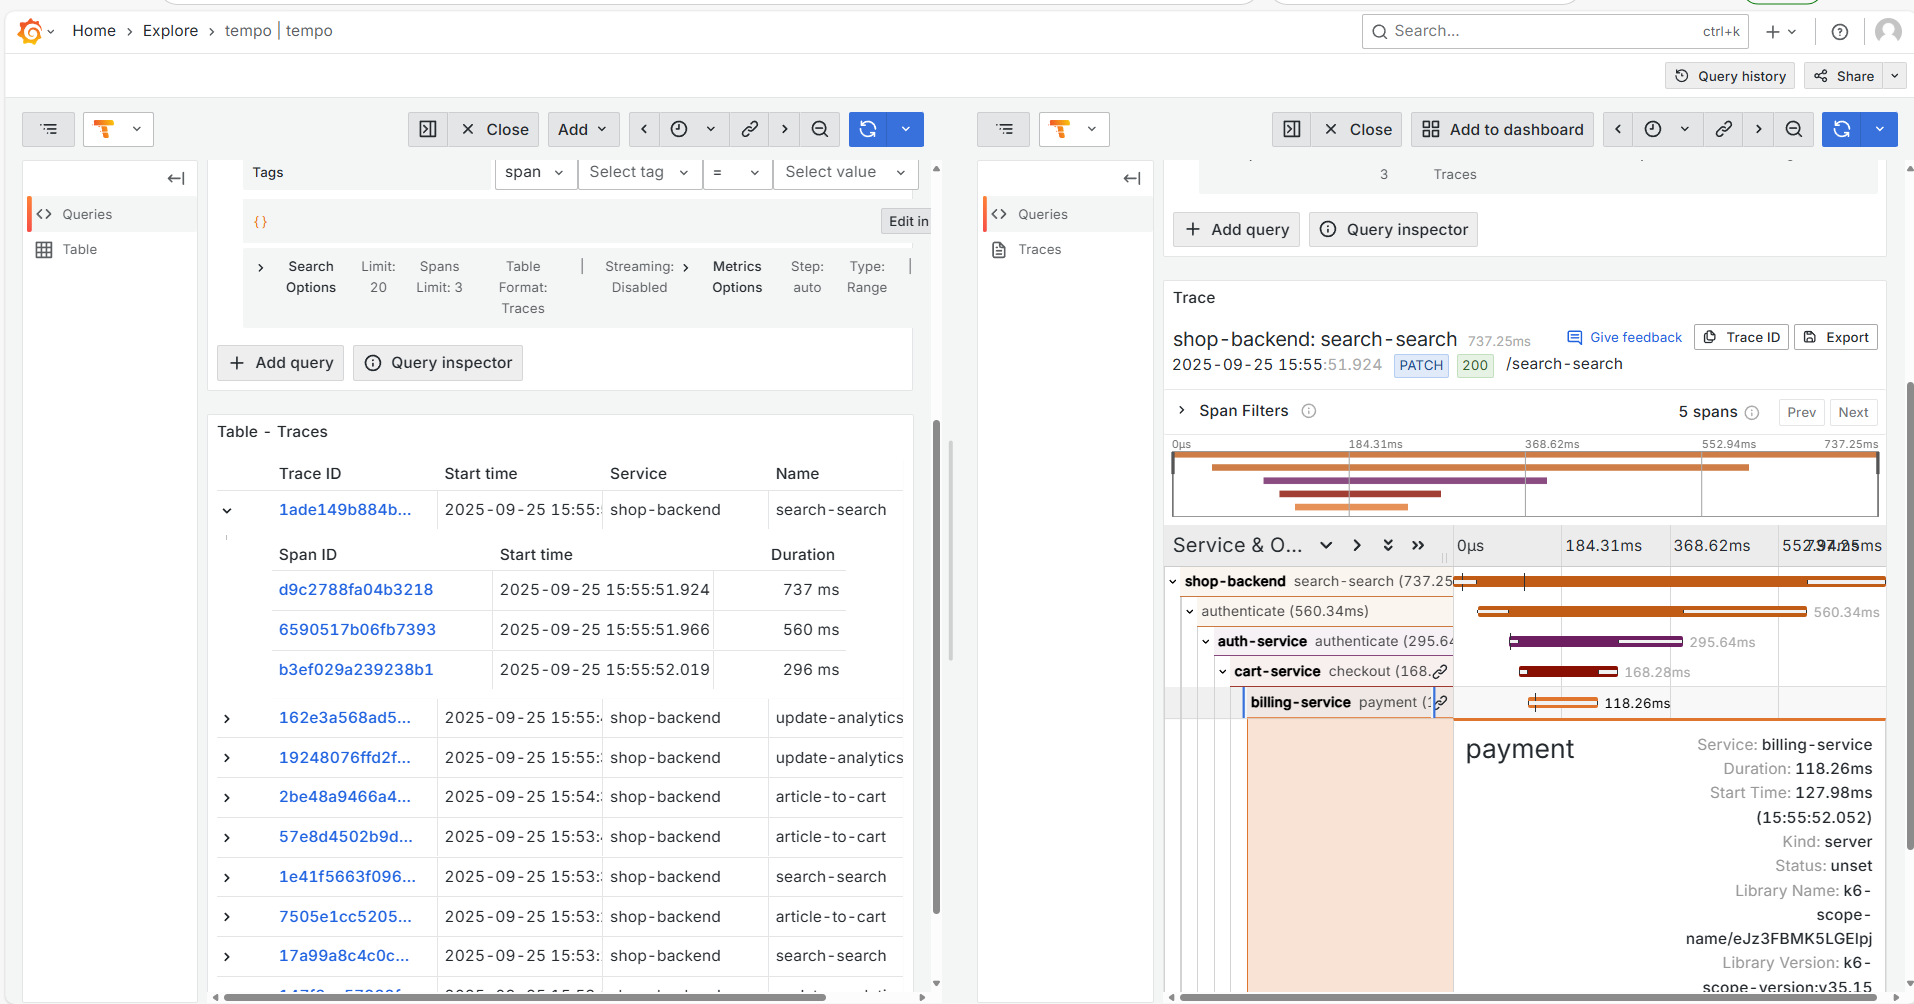
send_exemplars: trueExecute docker-compose up -d to deploy, then add the Tempo data source in Grafana. In the Drilldown/Traces, you can see some data, but mainly use the Explore menu to search and analyze traces.
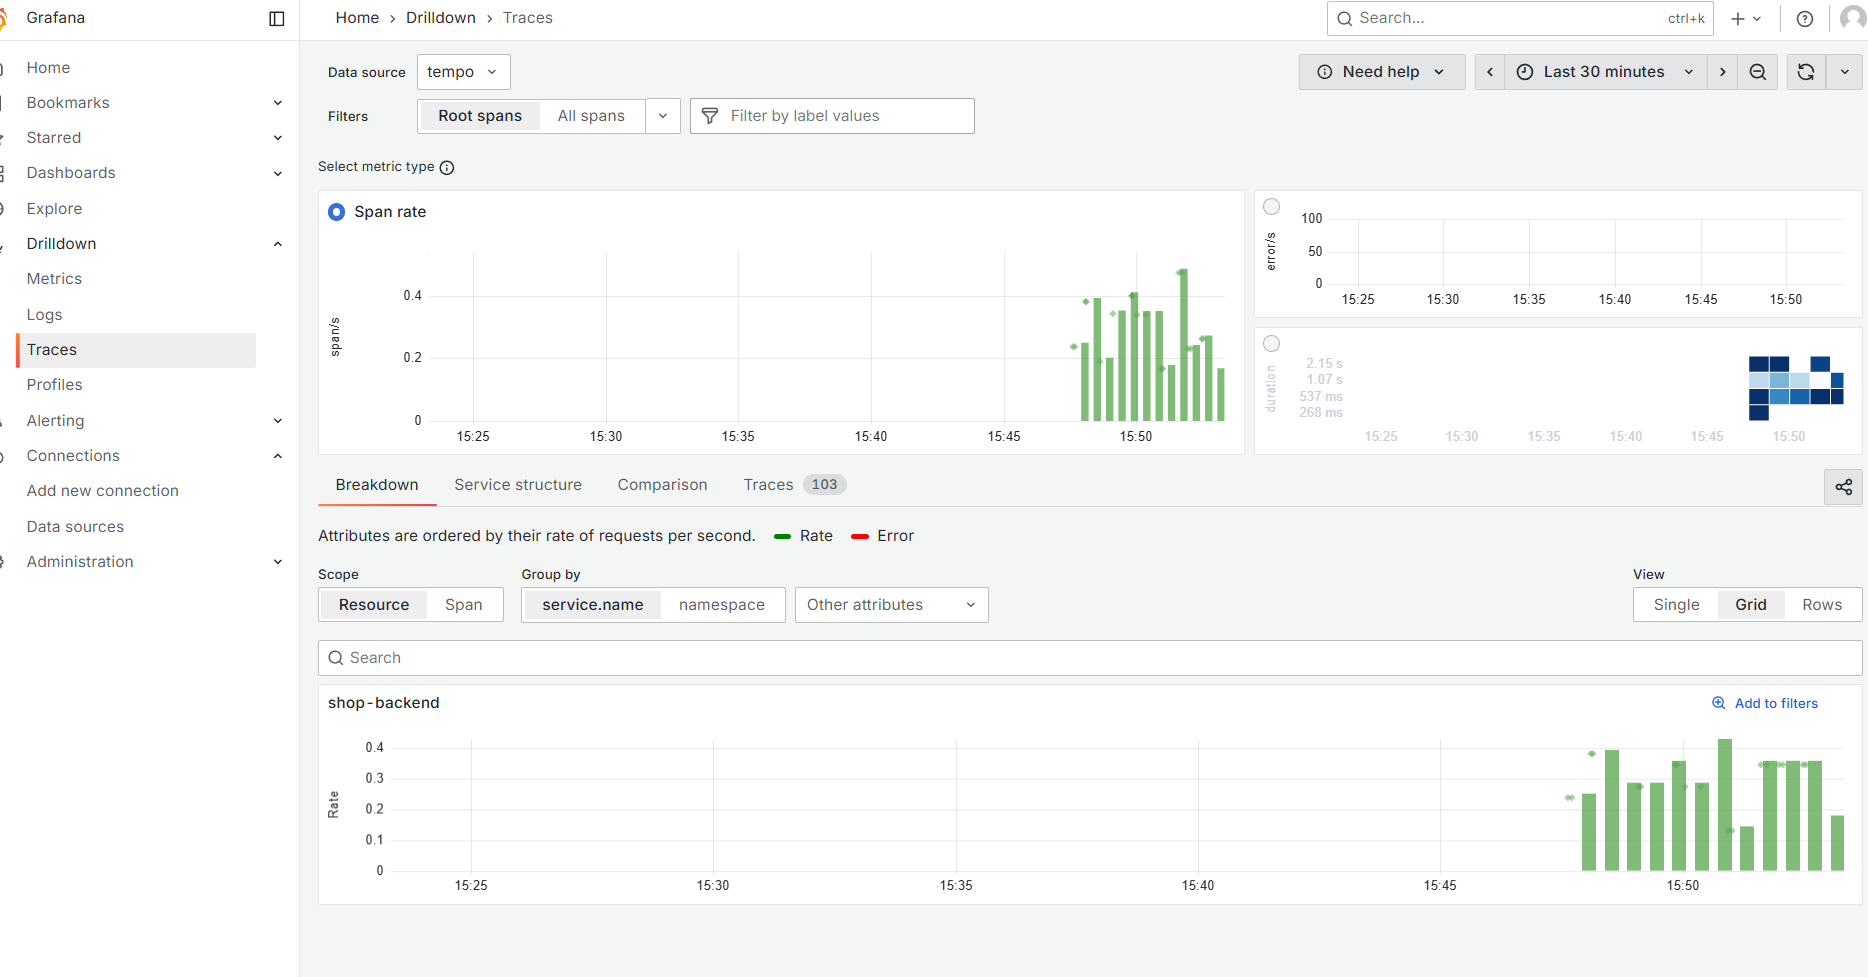
Among various trace visualization UIs, Tempo's UI feels quite comfortable.
.
By default, Tempo uses local TSDB storage, which does not support distributed storage. Therefore, for large-scale companies, it is recommended to use OSS storage.
However, TSDB indeed has strong performance.
Additionally, considering that when the company’s business grows large, the amount of tracing data increases rapidly, it is necessary to move tracing data from too long ago to other places.
Modify the tempo.yaml file to find the following content:
storage:
  trace:
    backend: local                     # backend configuration to use
    wal:
      path: /var/tempo/wal             # where to store the wal locally
    local:
      path: /var/tempo/blocks
Modify it to:
storage:
  trace:
    backend: s3
    s3:
      endpoint: 192.168.50.199:9000         # e.g., s3.us-east-1.amazonaws.com or MinIO address
      bucket: tempo           # S3 bucket name
      access_key: <ACCESS_KEY>        # S3 Access Key
      secret_key: <SECRET_KEY>        # S3 Secret Key
      region: <REGION>                # Region (optional, needed for some S3 compatible storage)
      insecure: true                  # Set to true if using HTTP protocol
      forcepathstyle: true            # Recommended to be enabled for MinIO and other S3 compatible storage
The author uses MinIO, which is relatively simple, and object storage services like Alibaba Cloud and Tencent Cloud also support the S3 protocol.
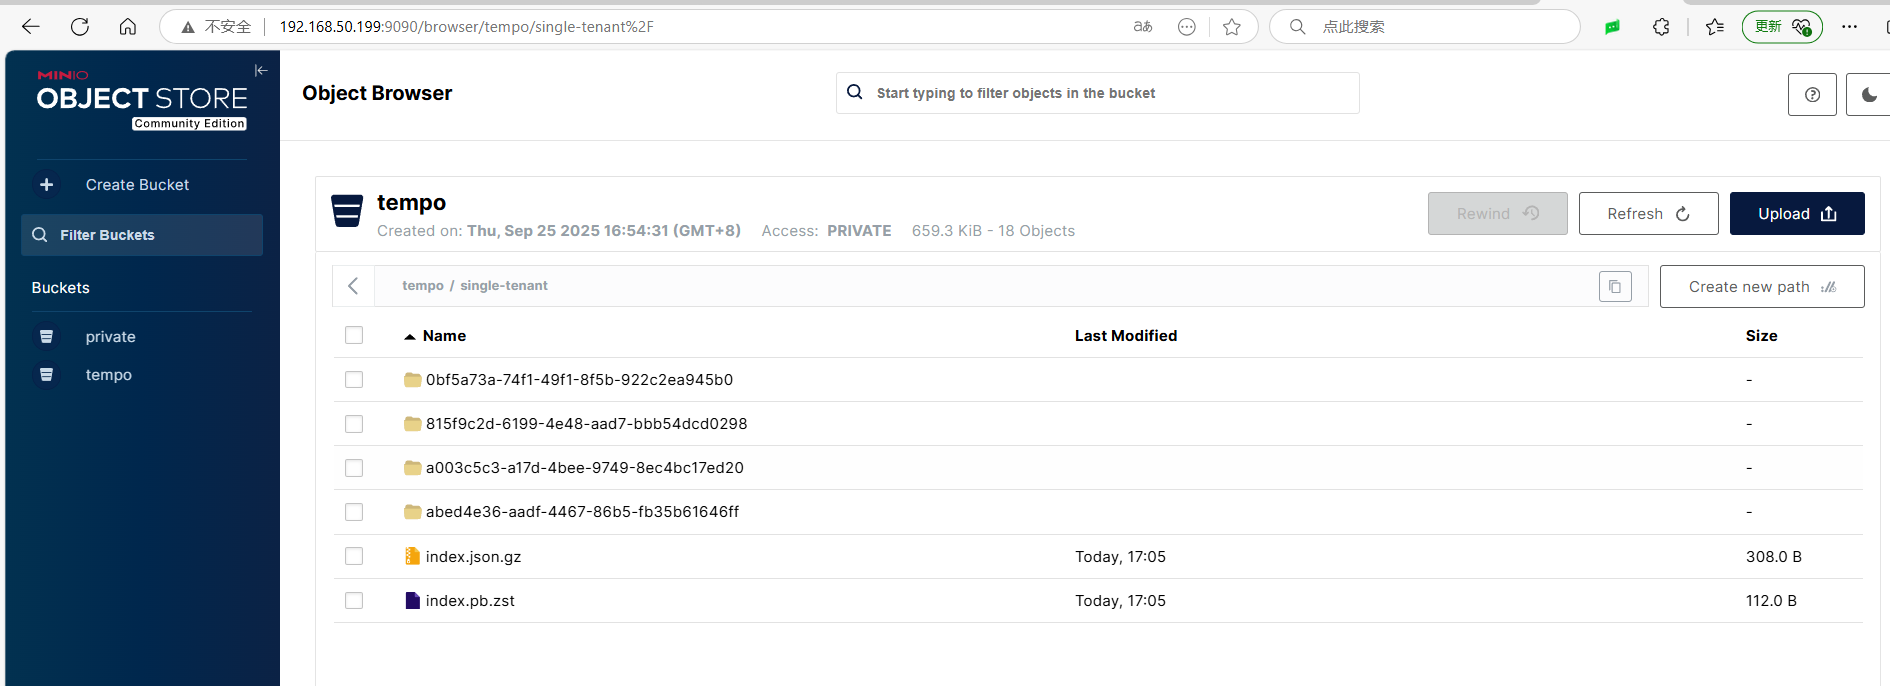
However, Tempo itself does not have an automatic data expiration or cleaning mechanism, so it relies on the object expiration mechanism of the OSS itself. For example, MinIO can use the mc tool to process expired objects daily, moving them to infrequent storage or deleting them.
As for solutions like SkyWalking + ElasticSearch, they will not be explained here; readers can try them on their own.
Low-Cost ClickStack Observability Platform
This section introduces the construction of a low-cost observability platform based on Clickhouse’s ClickStack.
ClickStack is a production-grade observability platform based on ClickHouse and OpenTelemetry (OTel), unifying logs, traces, metrics, and sessions to provide a single high-performance solution. Designed to monitor and debug complex systems, ClickStack allows developers and SREs to trace issues end-to-end without switching between tools or manually piecing together data using timestamps or correlation IDs.
Introduction from the official website: https://clickhouse.com/docs/zh/use-cases/observability/clickstack/overview
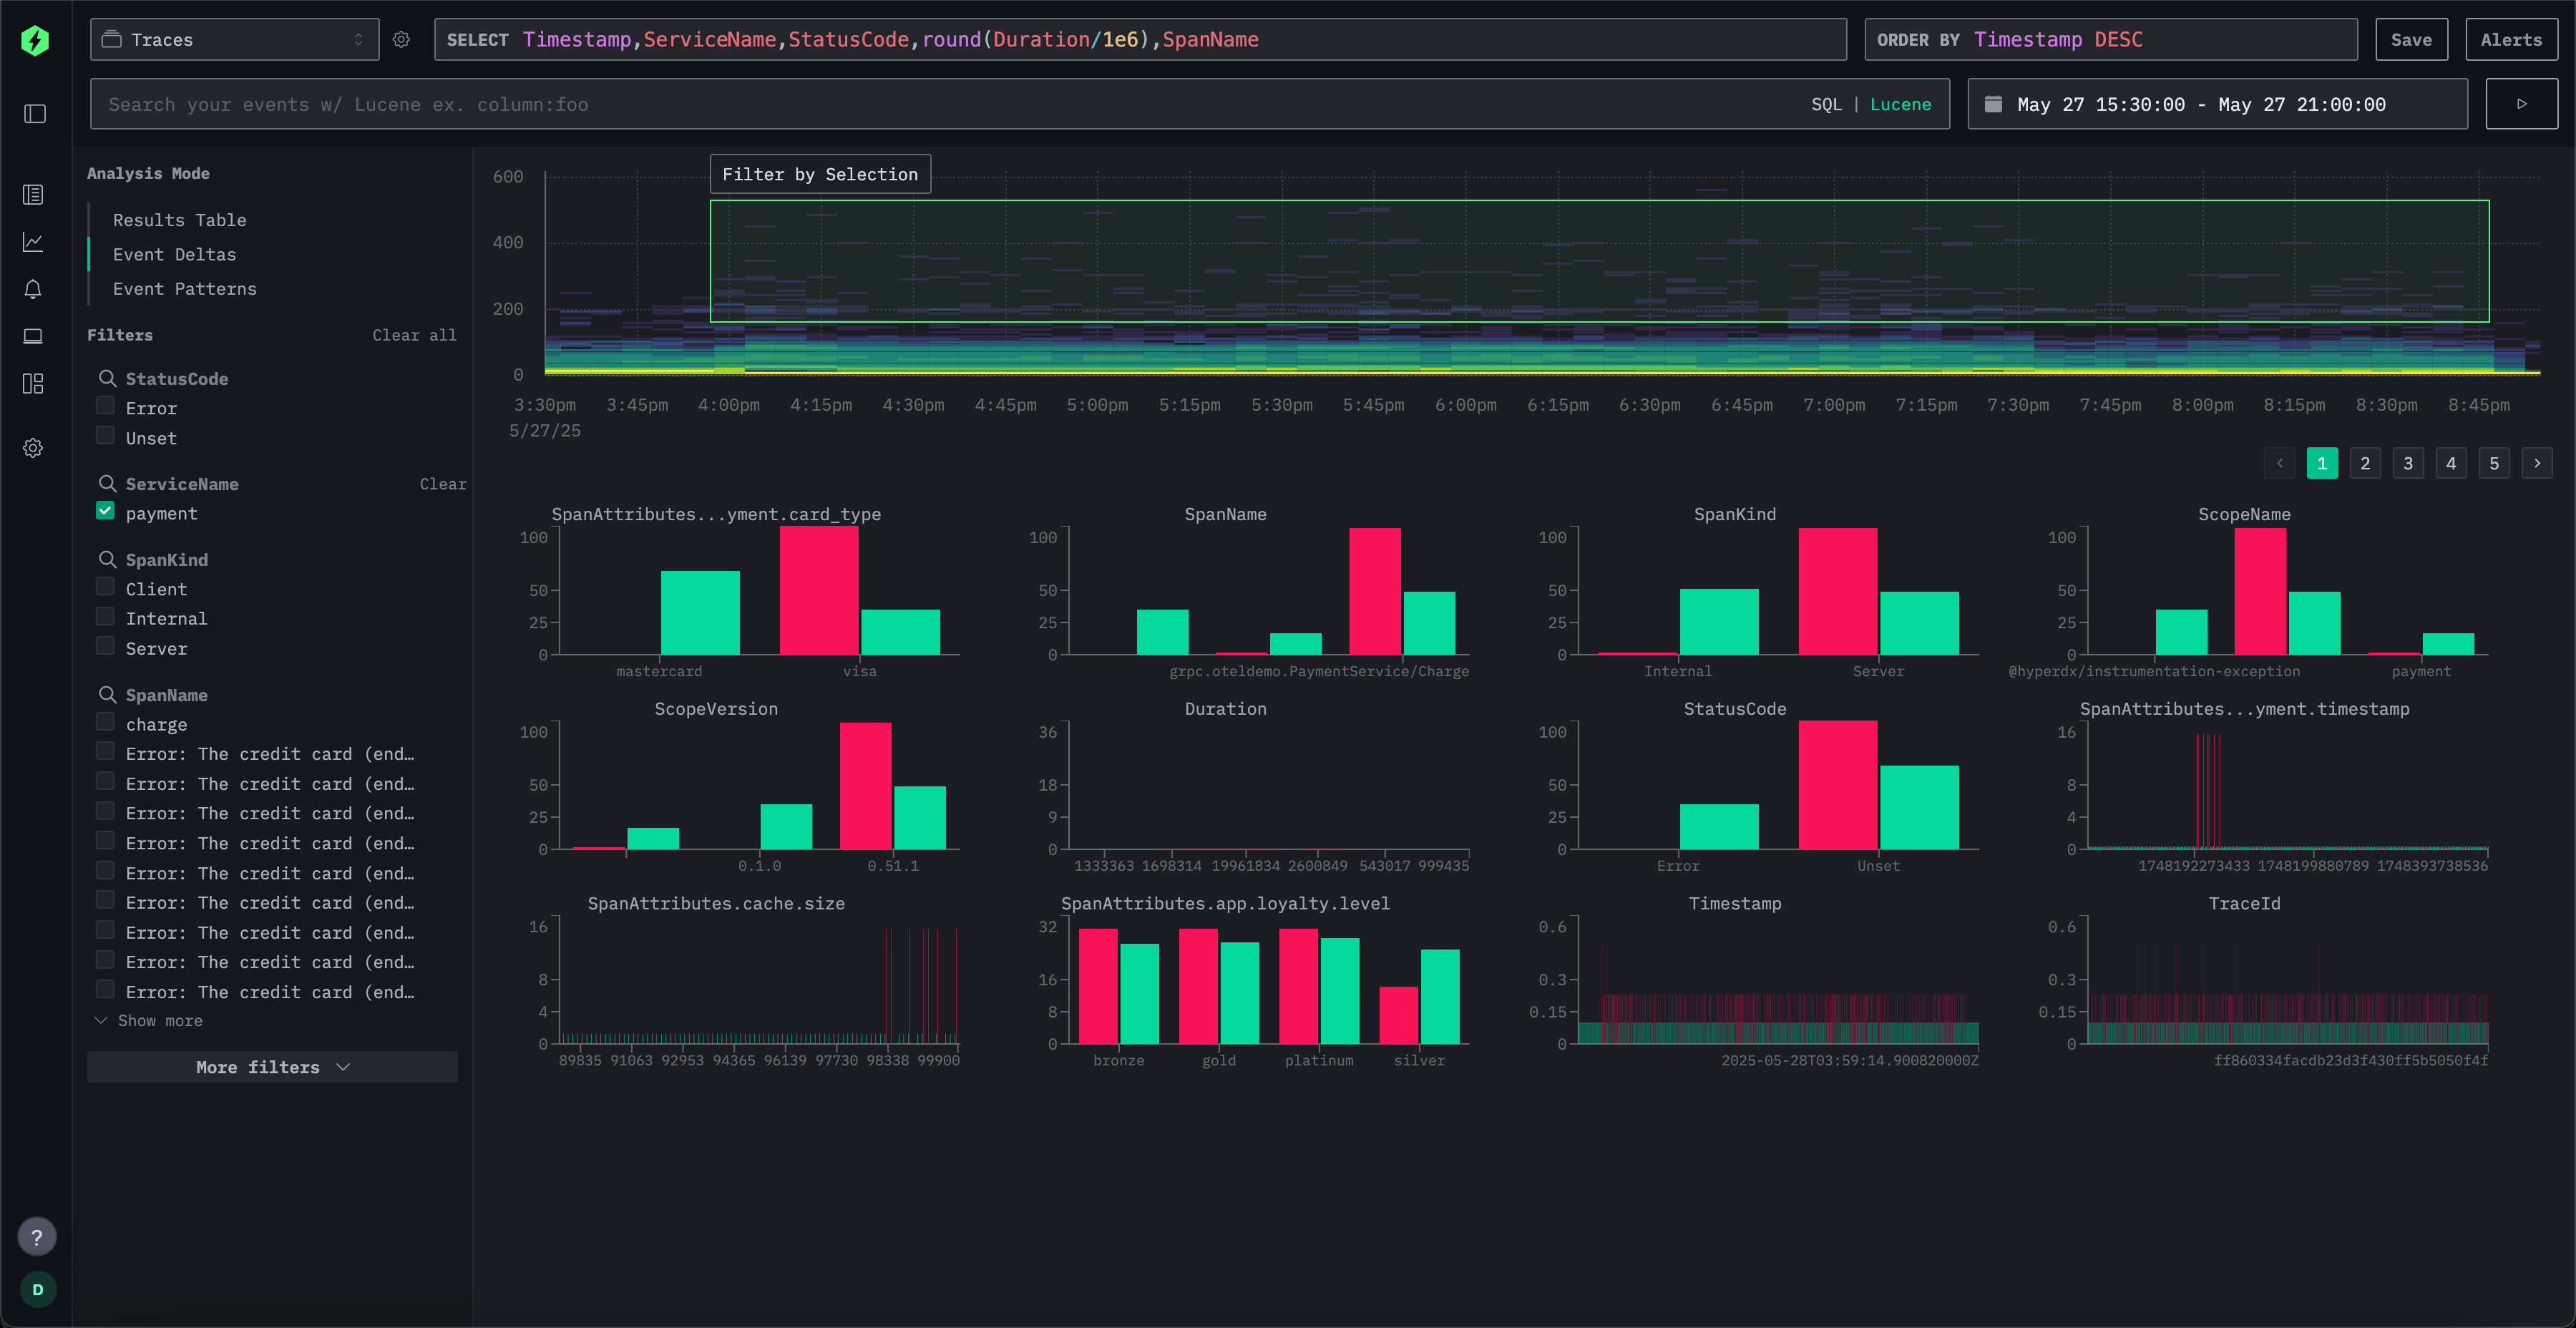
Image from ClickStack official documentation.
ClickStack consists of three core components:
- HyperDX UI – A frontend designed for exploring and visualizing observability data
- OpenTelemetry collector – A custom-built, pre-configured collector with a stance-oriented architecture for logs, traces, and metrics
- ClickHouse – The high-performance analytical database that forms the core of the stack
These components can be deployed independently or together, and official images are provided, making deployment relatively simple.
For convenience, the author here uses the All-in-One deployment method, where all components are deployed in a single Docker container. However, for production requiring fault tolerance and distributed deployment, it is recommended to follow the official documentation. If the scale is small and requirements are not high, All-in-One is a good choice, as a single container supports the three major components without the need for many middleware services.
Official documentation address: https://clickhouse.com/docs/zh/use-cases/observability/clickstack/deployment
| Name | Description | Applicable Users | Limitations |
|---|---|---|---|
| All-in-One | A single Docker container bundling all ClickStack components. | Demonstration, partial full-stack testing | Not recommended for production |
| Helm | Official Helm chart for Kubernetes-based deployments. Supports ClickHouse Cloud and production scaling. | Production deployment on Kubernetes | Requires Kubernetes knowledge, customization via Helm |
| Docker Compose | Deploy each ClickStack component separately using Docker Compose. | Local testing, proof of concept, production on a single server, self-managed ClickHouse | No fault tolerance, requires management of multiple containers |
| HyperDX Only | Use HyperDX independently with your own ClickHouse and architecture. | Existing ClickHouse users, custom event pipelines | ClickHouse not included, users must manage data ingestion and architecture |
| Local Mode Only | Runs entirely in the browser with local storage. No backend or persistence. | Demonstration, debugging, development with HyperDX | No authentication, no persistence, no alerts, single-user only |
Deploy ClickStack
Create a new directory:
mkdir /data/clickstack
mkdir /data/clickstack/db
mkdir /data/clickstack/ch_data
mkdir /data/clickstack/ch_logs

chmod -R 777 /data/clickstack/*
Deploy the service:
docker run -itd --restart=always \
  -p 8080:8080 \
  -p 4317:4317 \
  -p 4318:4318 \
  -e FRONTEND_URL="http://192.168.50.199:8080" \
  -v "/data/clickstack/db:/data/db" \
  -v "/data/clickstack/ch_data:/var/lib/clickhouse" \
  -v "/data/clickstack/ch_logs:/var/log/clickhouse-server" \
  docker.hyperdx.io/hyperdx/hyperdx-all-in-one
Domestic users with configured image accelerators can remove the
docker.hyperdx.io/prefix from the image.
Deployment Options | ClickHouse Docs
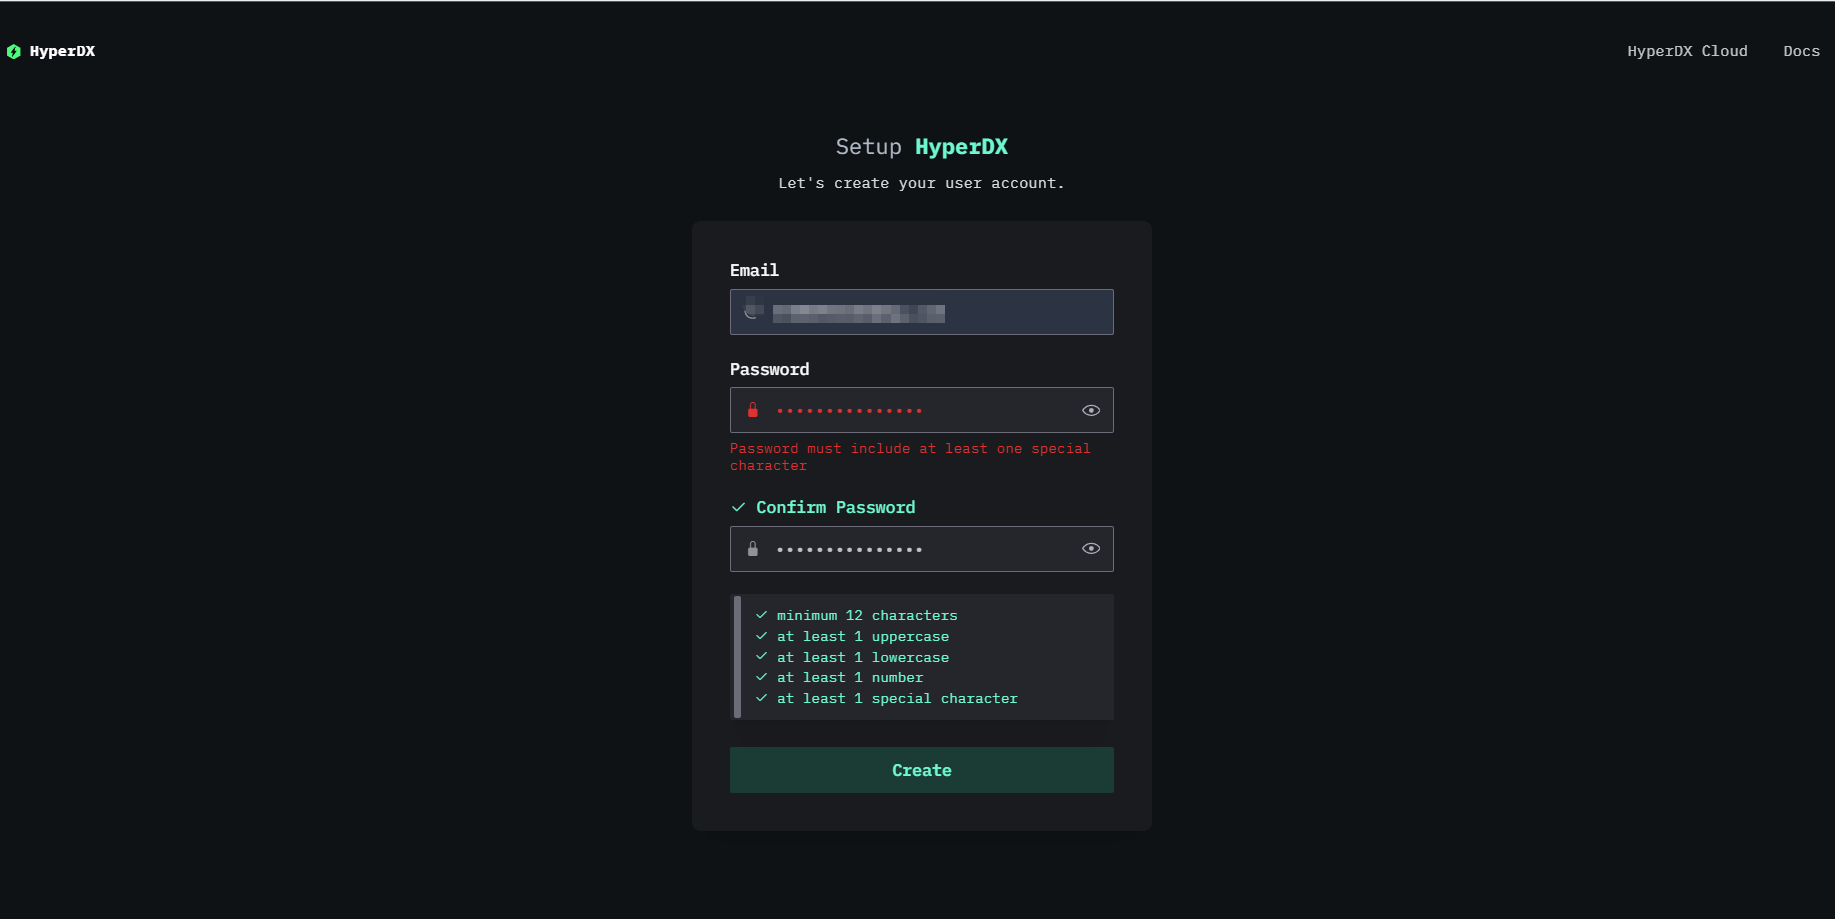
Open port 8080 to access the HyperDX UI.
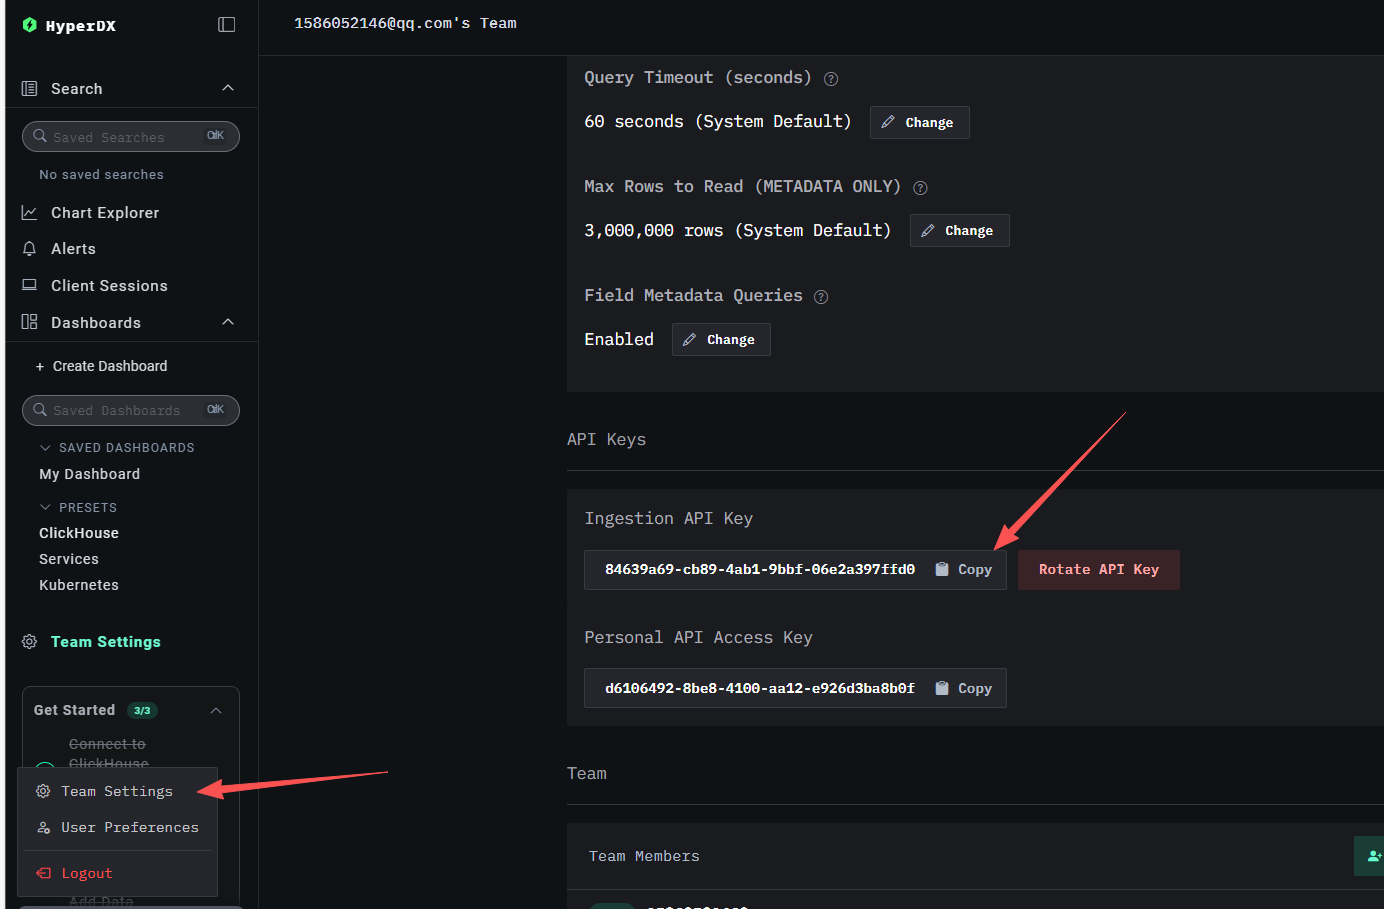
Open the Team Settings configuration, copy the API Key, which will be needed when interfacing with OpenTelemetry to push data.
To observe the use of ClickStack, you can write a program to push data or use the official simulated data.
Official simulated data tutorial: https://clickhouse.com/docs/zh/use-cases/observability/clickstack/getting-started/sample-data#load-sample-data
ClickStack has already configured various data sources by default.
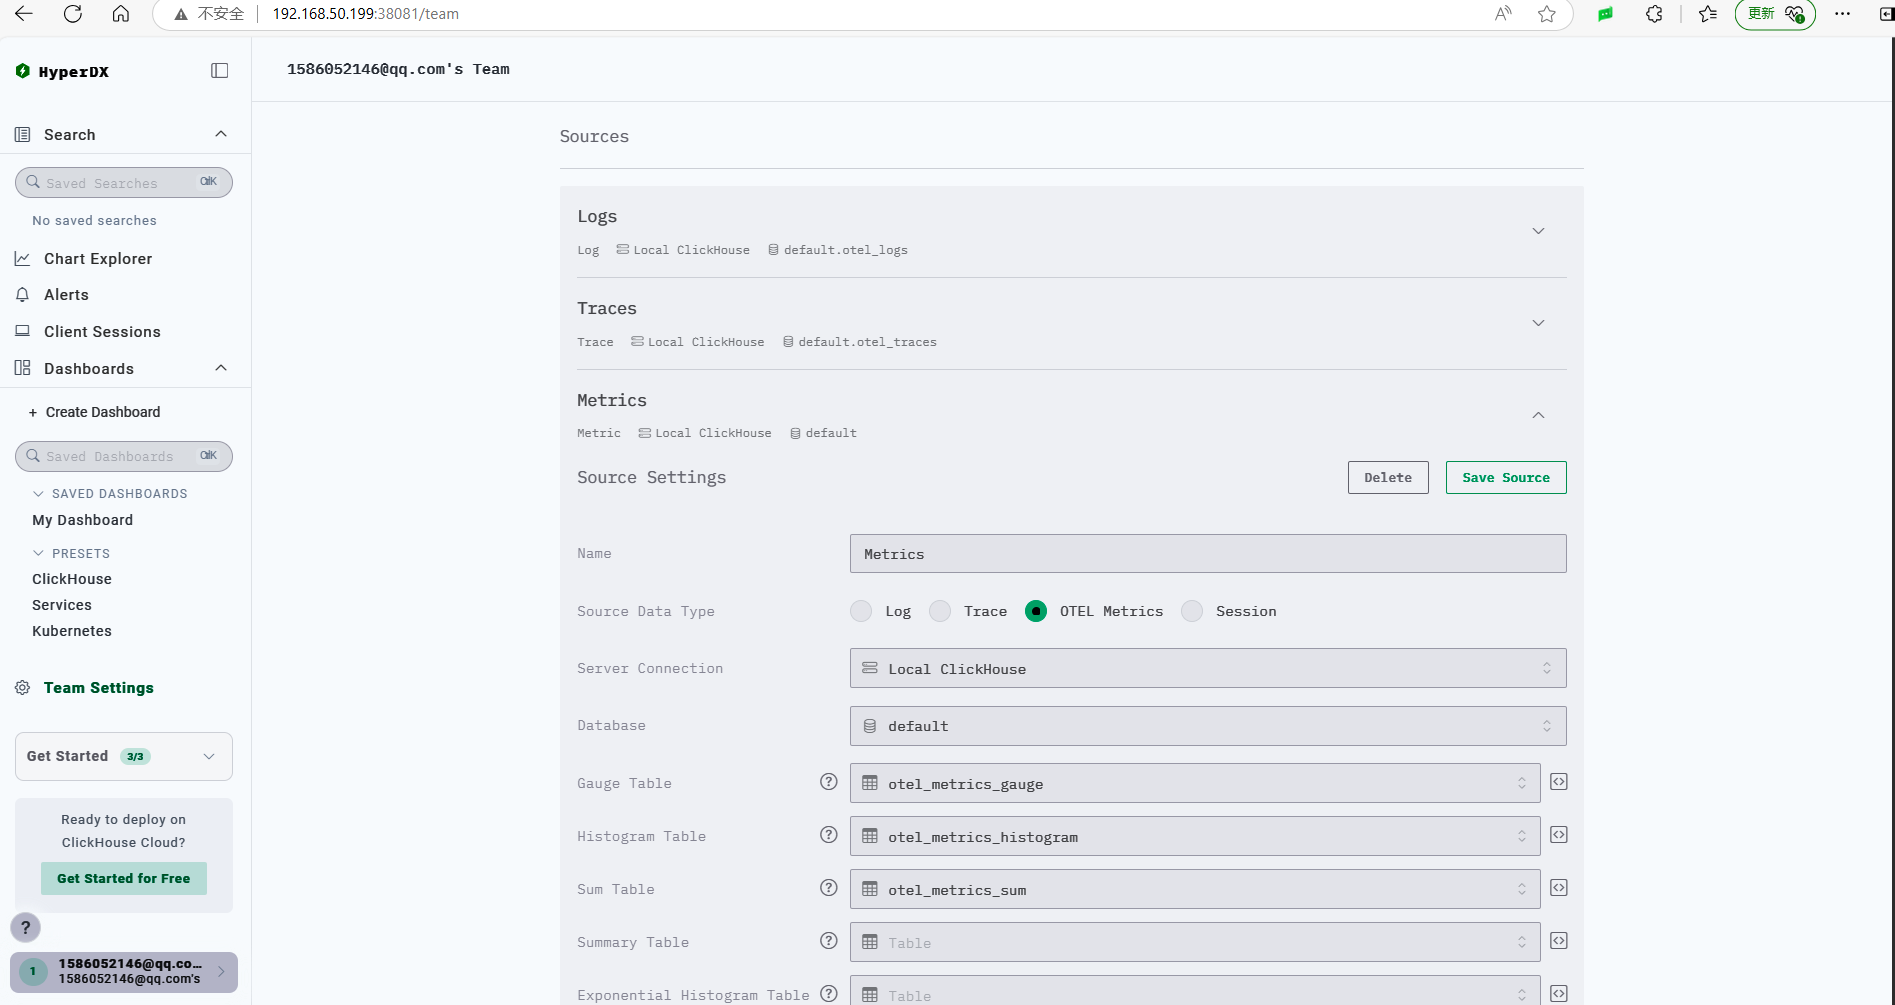
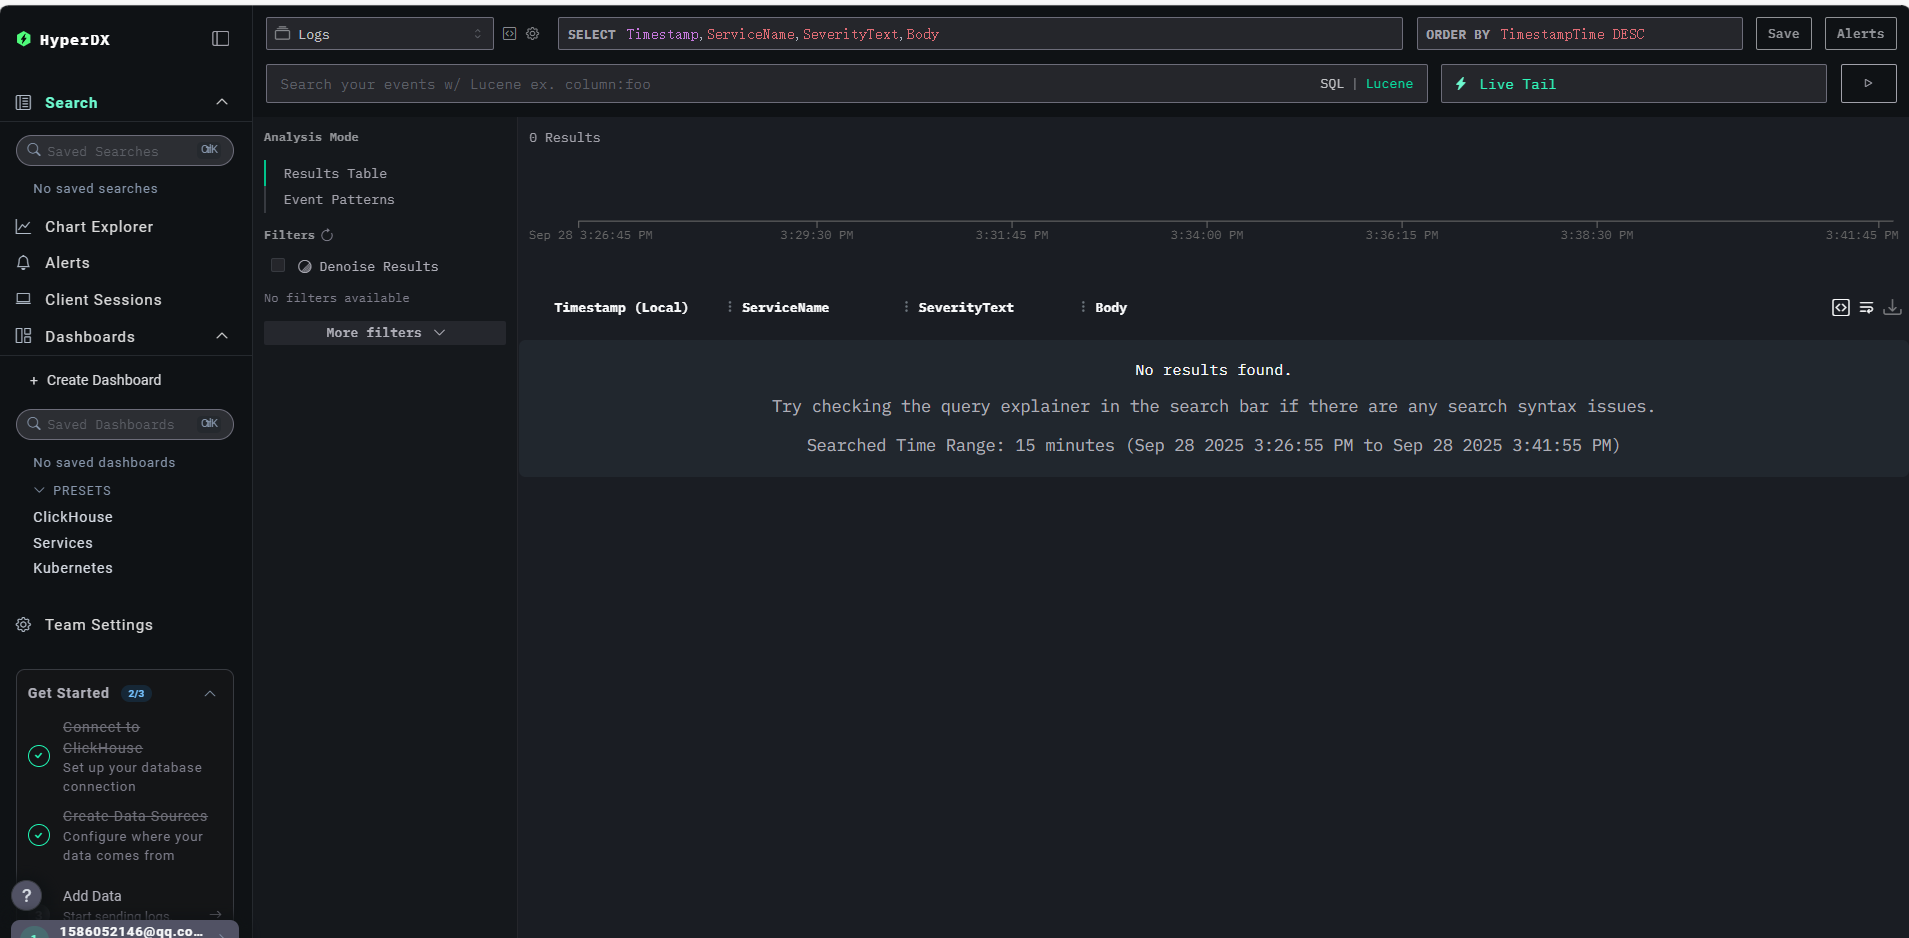
If you need to view only the data source, you can operate in the left menu Search.
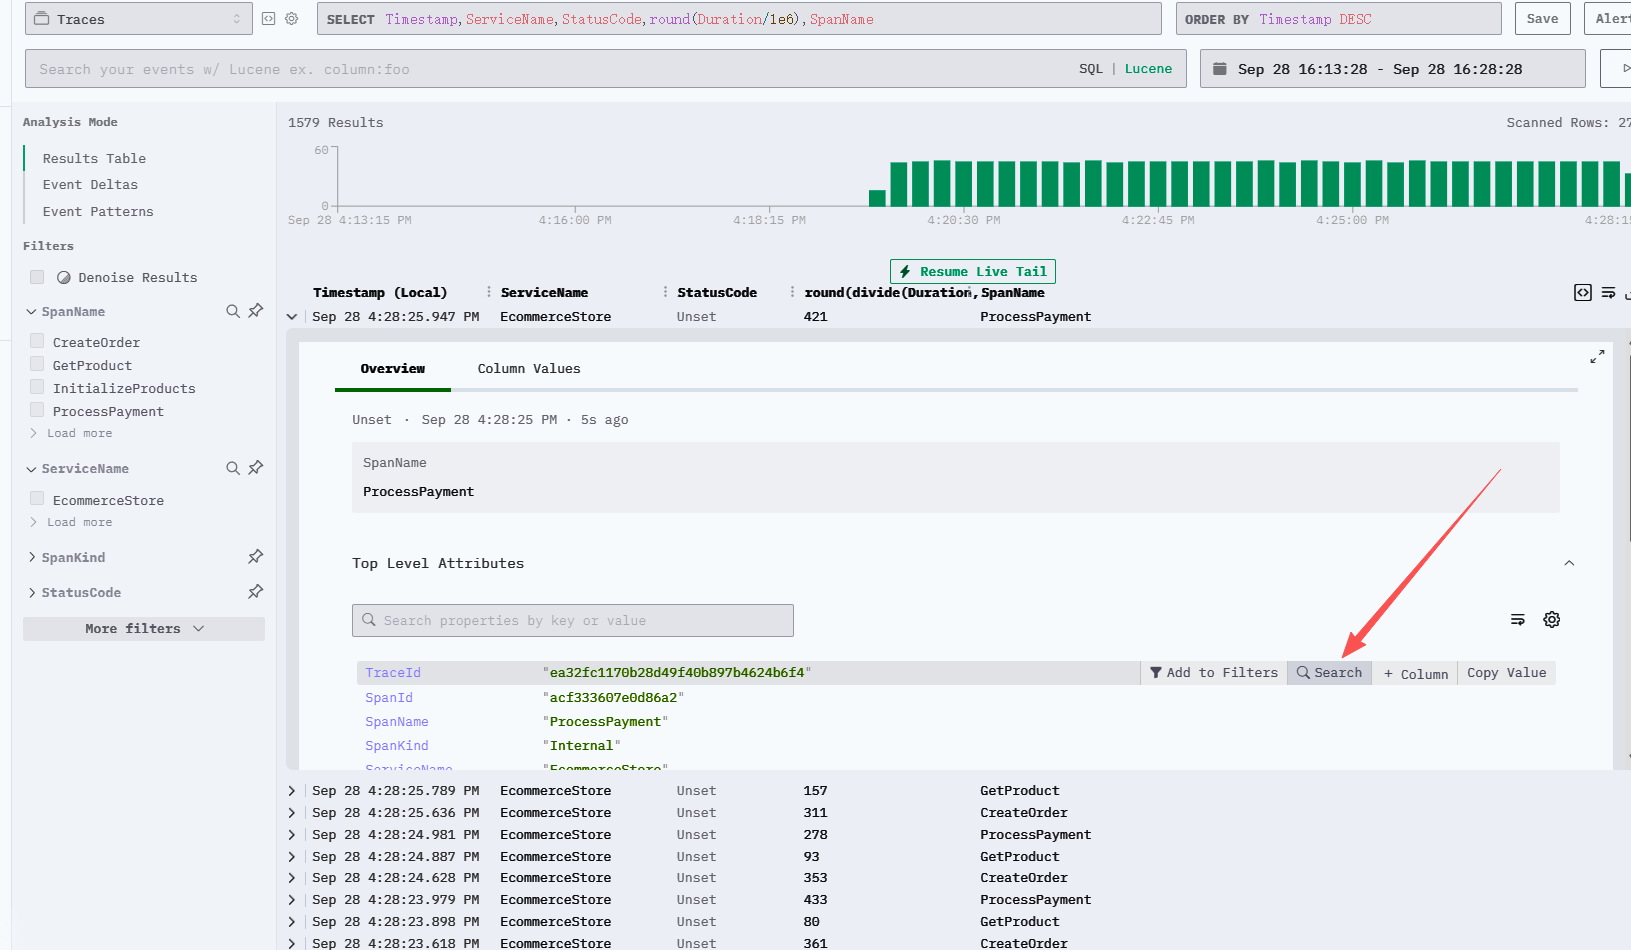
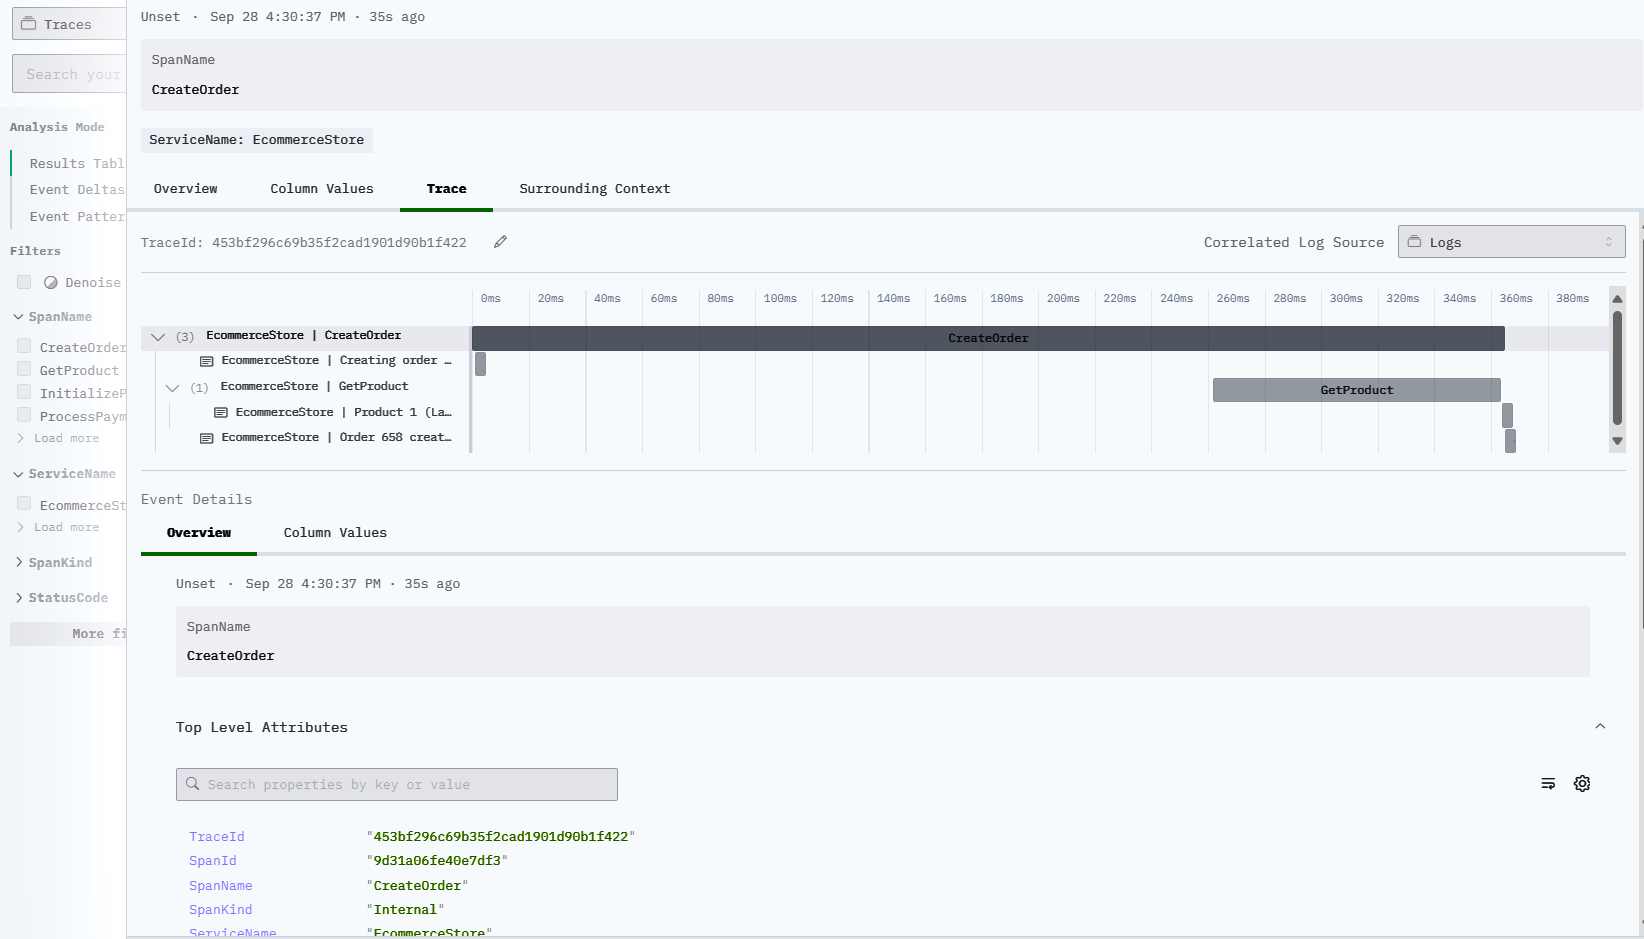
Search Traces
Taking Traces as an example, by default, ClickStack displays them according to spans. You can click on a specific span to search for the corresponding TraceId or use a condition like TraceId = 'ea32fc1170b28d49f40b897b4624b6f4'.
Animated demonstration:
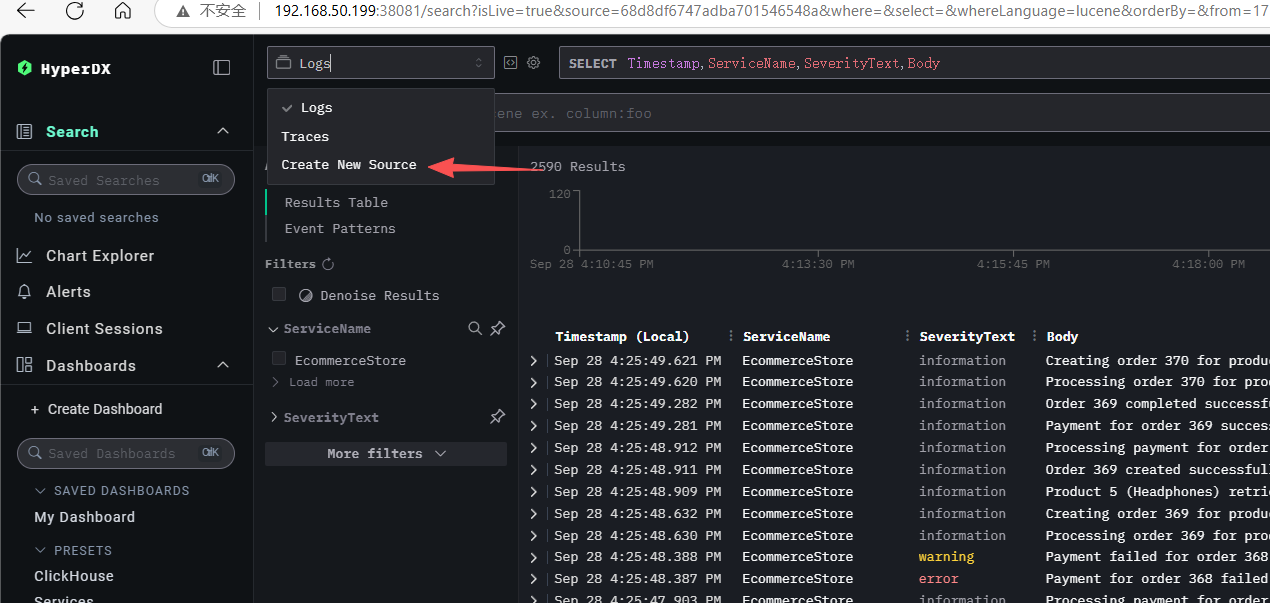
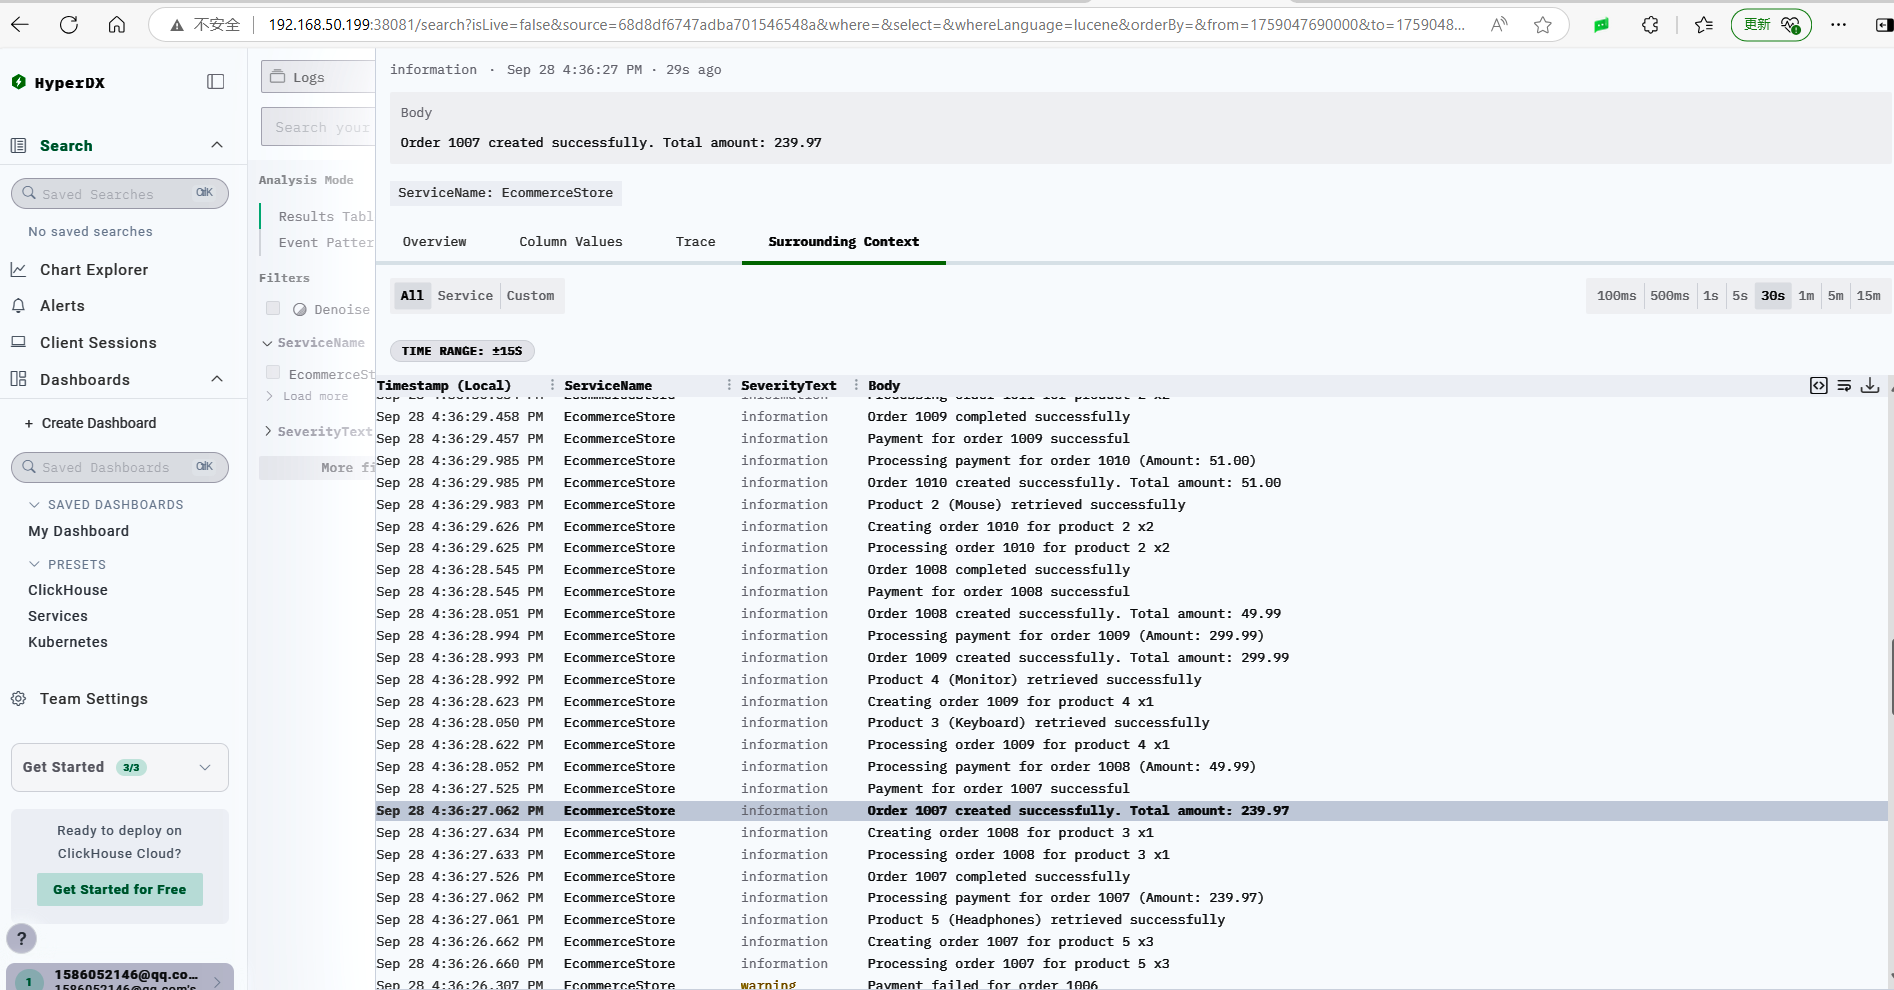
Search Logs
ClickStack’s logs have a useful feature that automatically aggregates context. For example, this log has a corresponding TraceId, and the Surrounding Context shows a list of logs that occurred in sequence with the same TraceId.
View Metrics
ClickStack’s charts do not look as nice as Grafana, and the interface is relatively rudimentary.
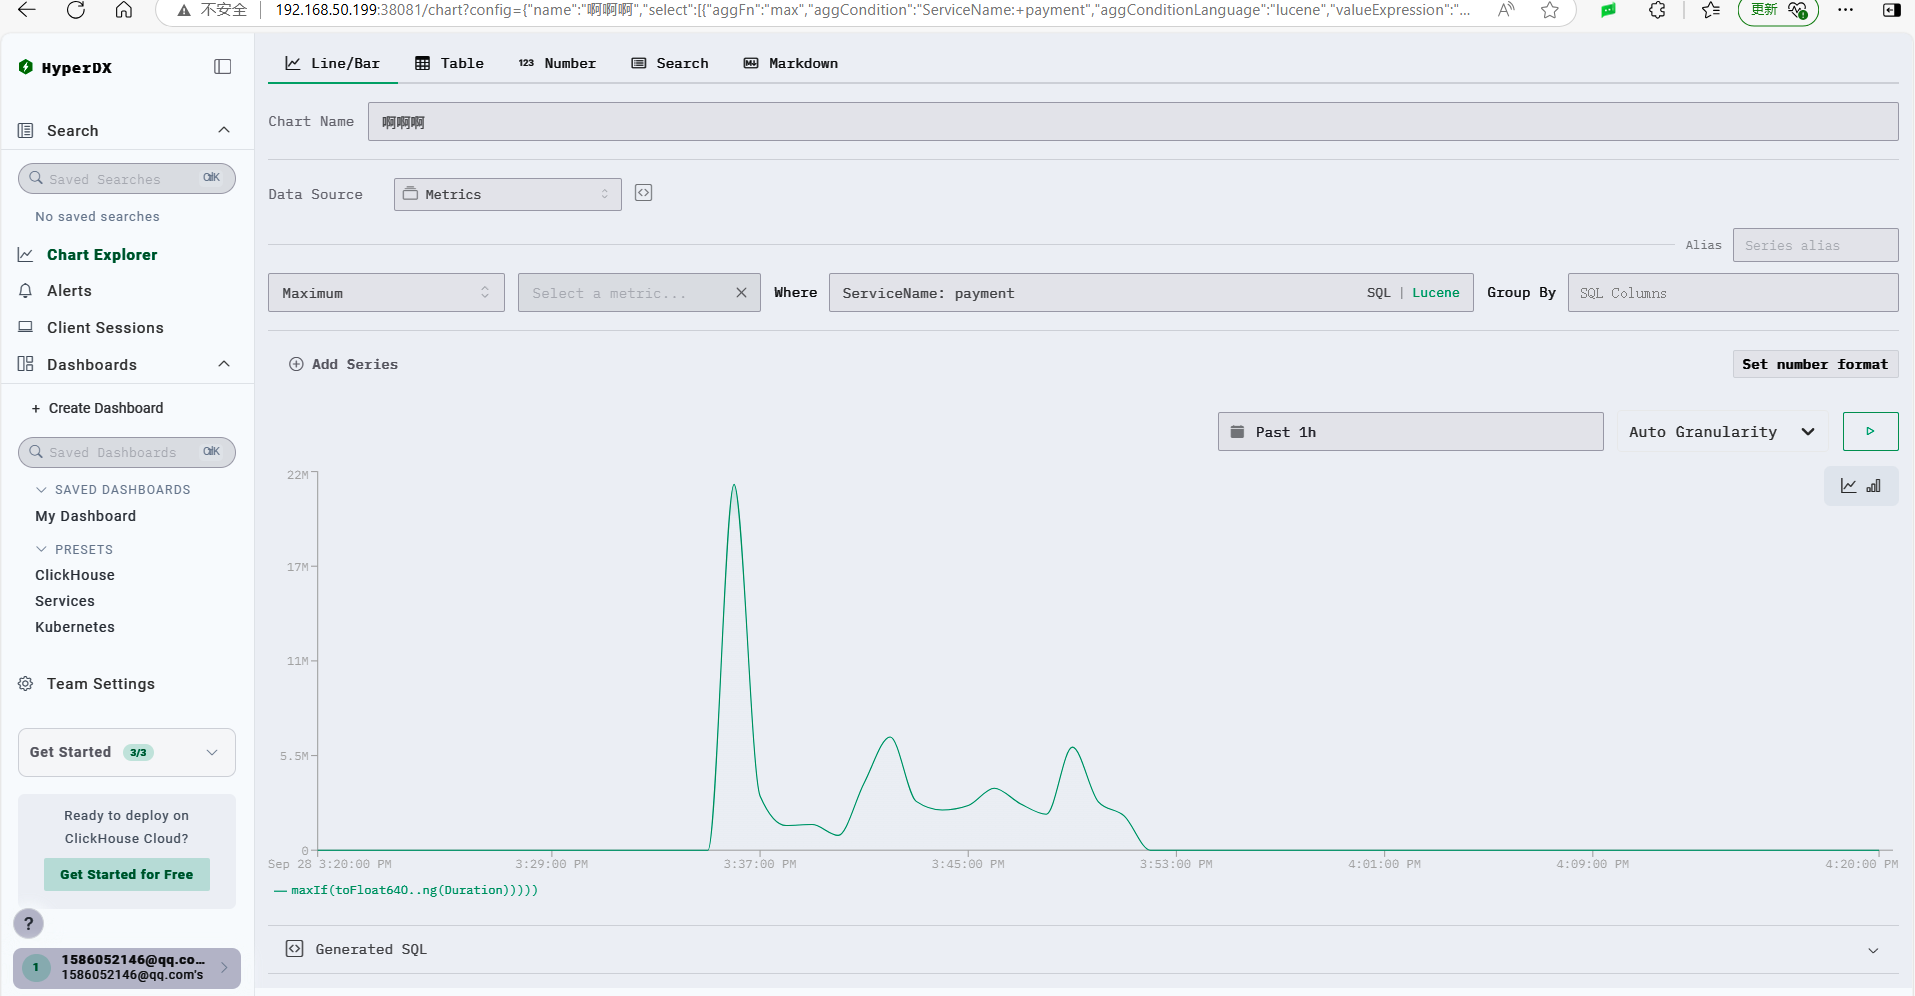
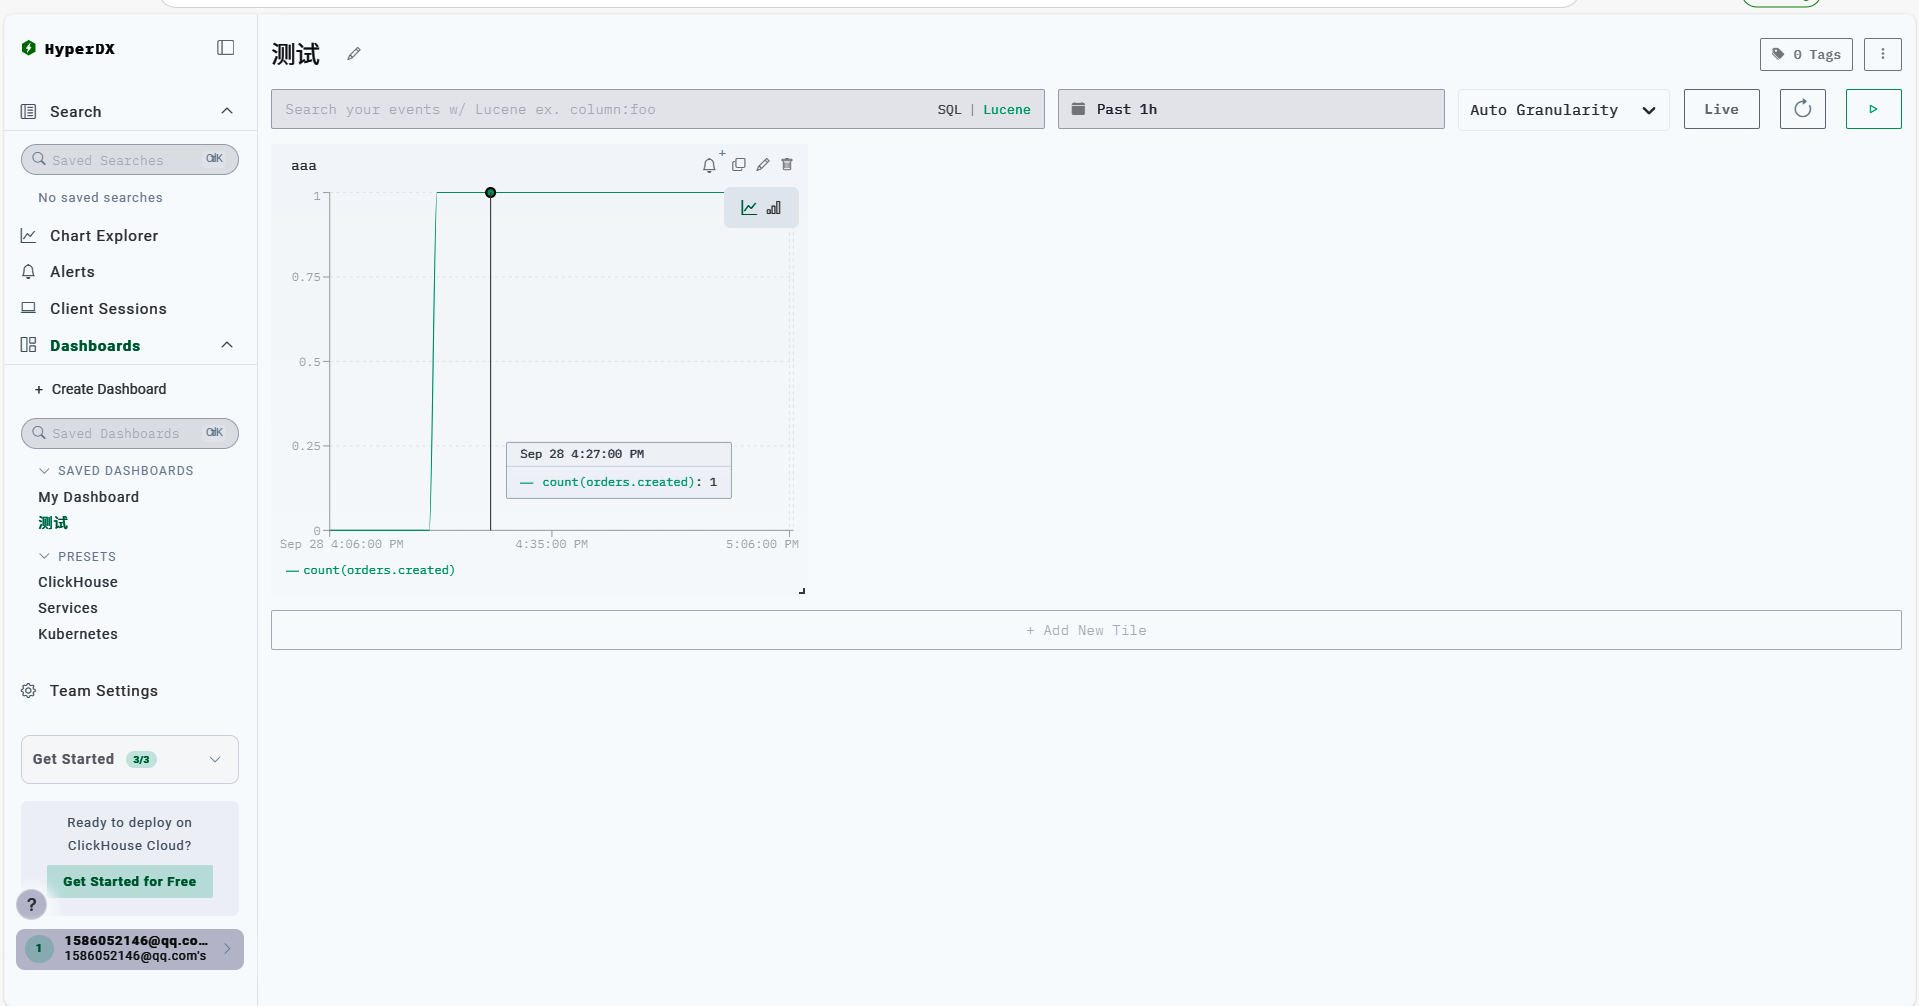
For example, the author’s demo program has an orders.created counter for order creation, which increments the counter by +1 for each new order.
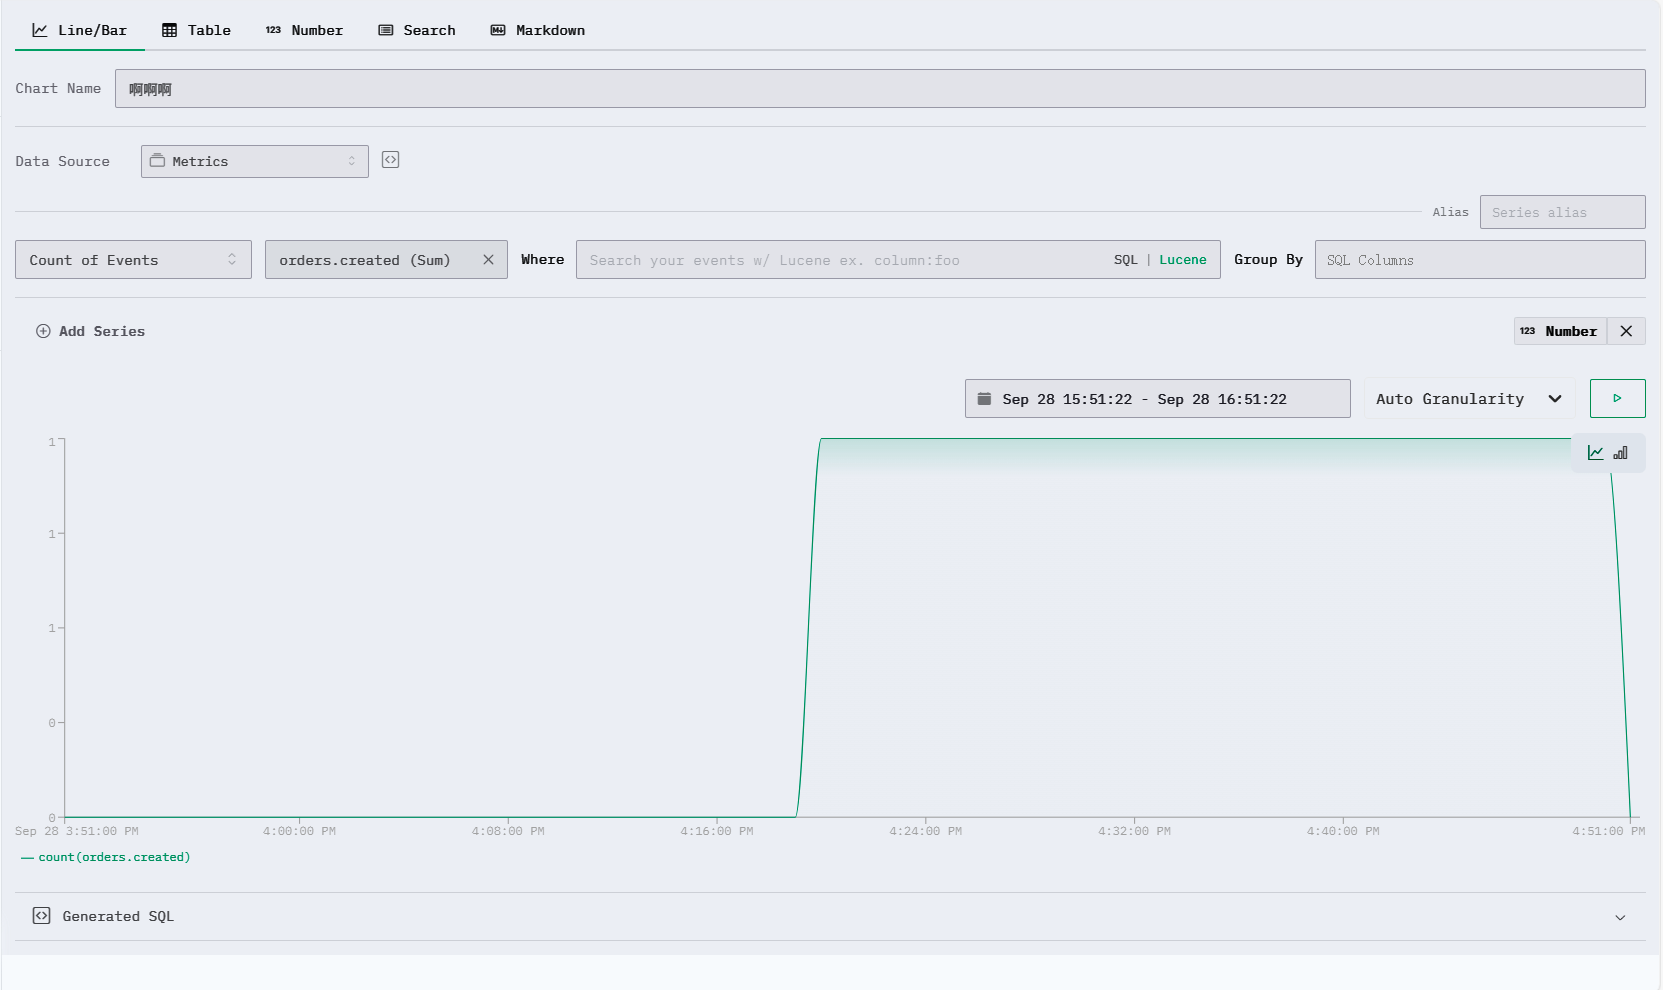
You can add new panels to display the charts you need.
However, its features are not as powerful as Grafana, and there are no community templates, so you need to configure it bit by bit.
Others
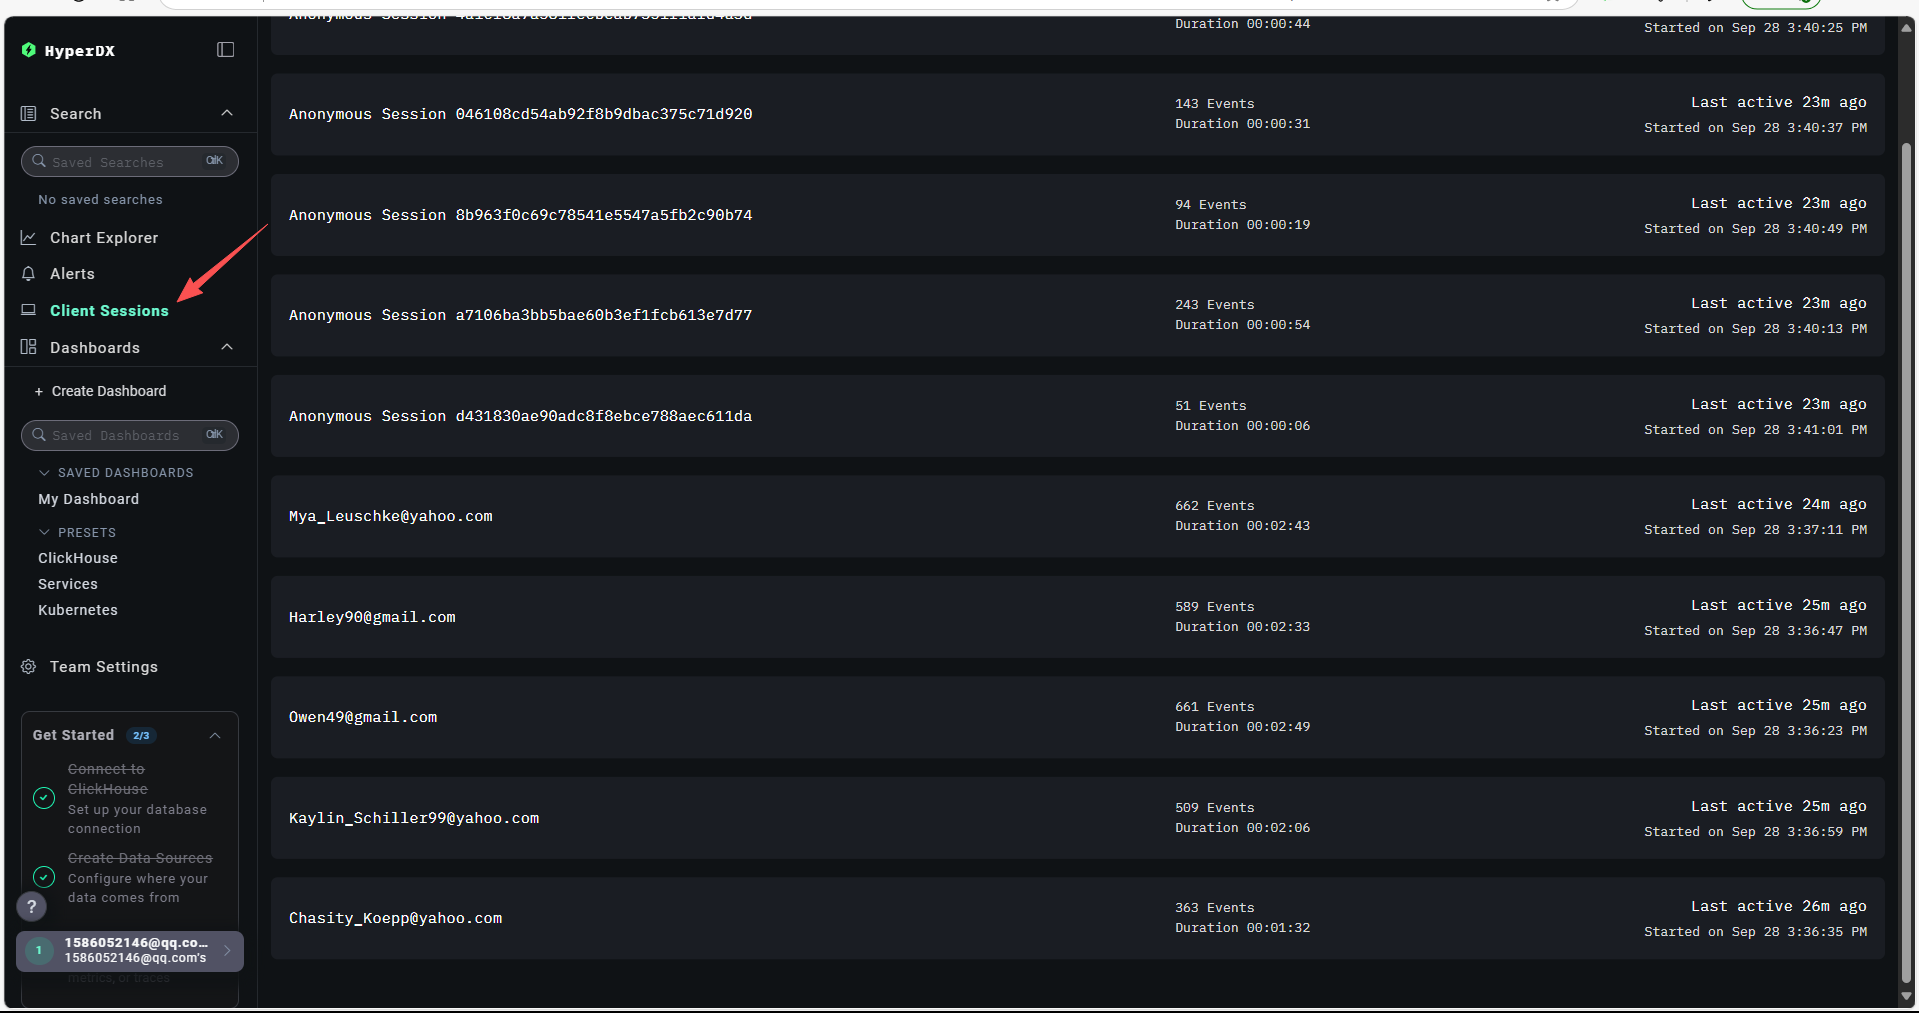
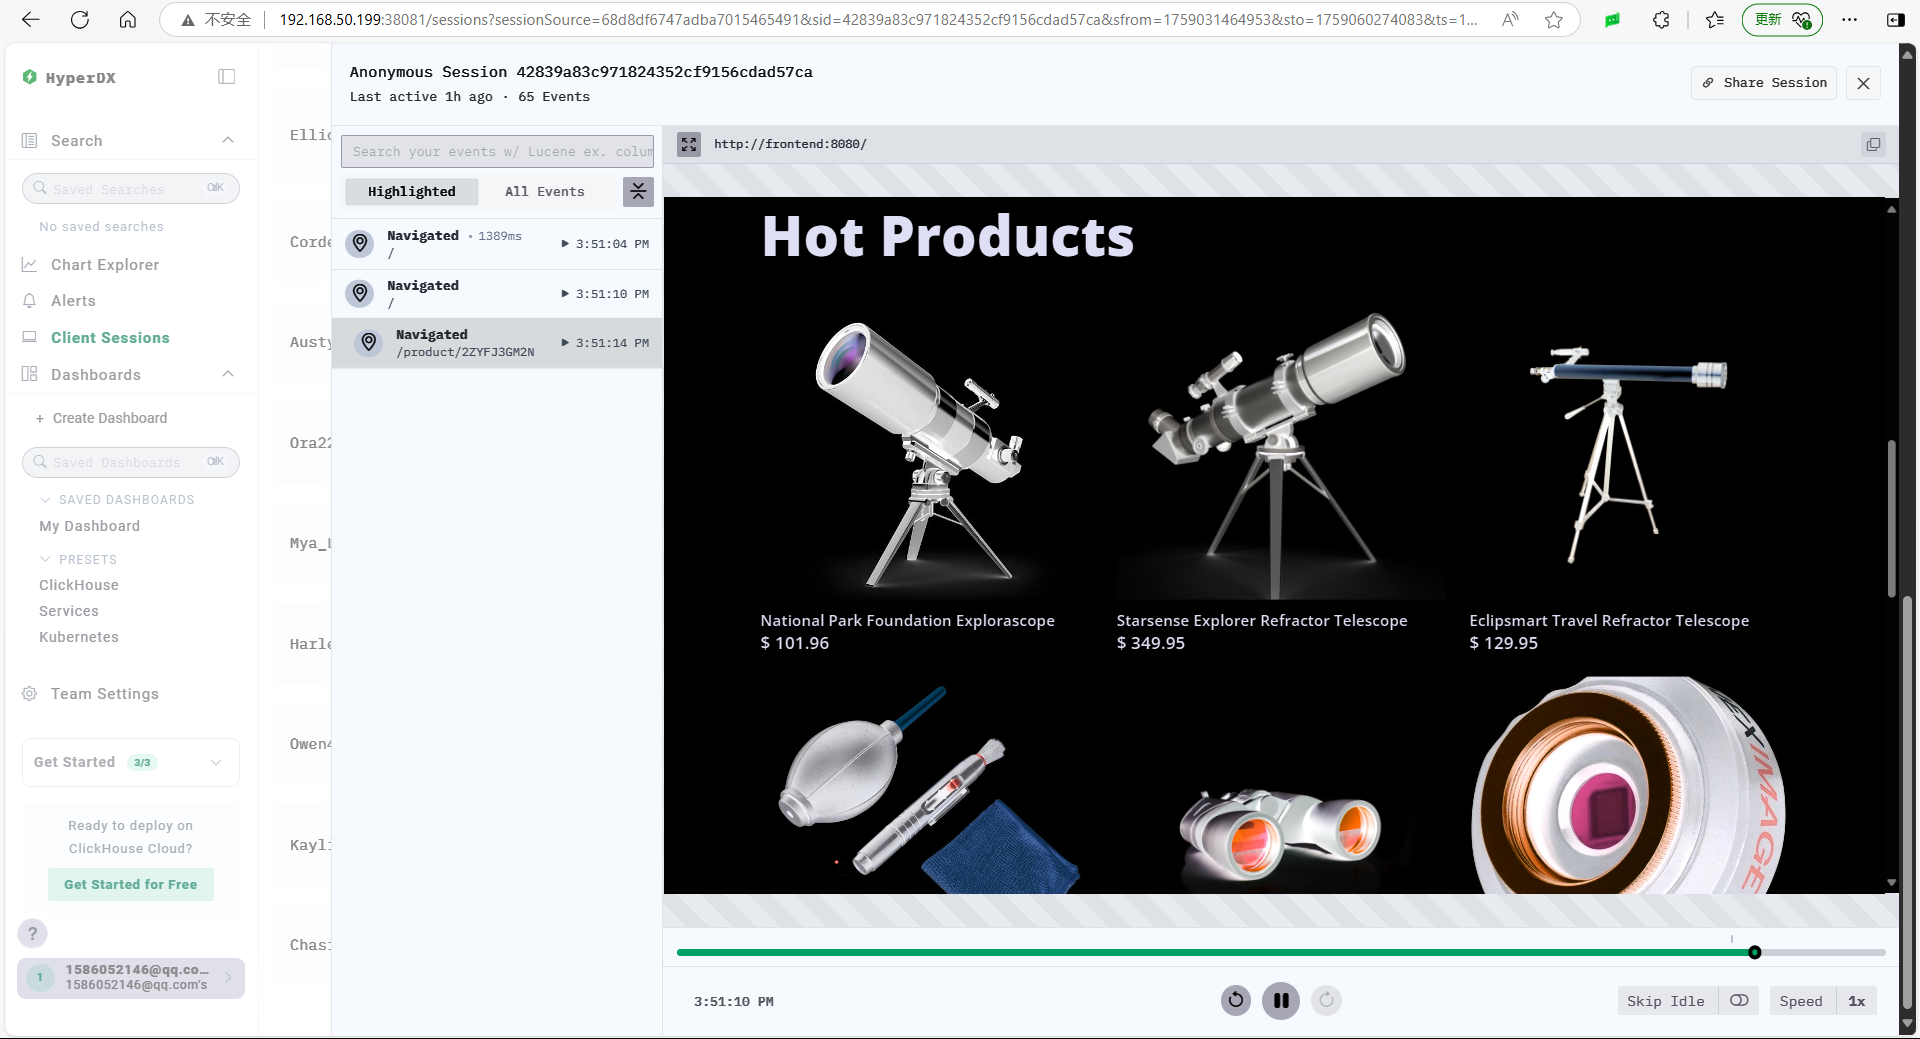
ClickStack has a very useful feature called session replay, which can record user actions on the page.

文章评论
ss飒飒