There are three articles in this series:
Logs and distributed link tracking in .NET Core
The basic implementation principle of the distributed link tracking framework (current)
Open source a simple framework compatible with Jaeger
Lemon (Lemon丶) opened the Lemon Research Institute in January. The research institute guides members to learn distributed and cloud-native technologies. This month’s topic is distributed Link tracking, learn Dapper papers, the use of Jaeger, and complete a link tracking framework compatible with Jaeger.
The author divides the homework into three parts, one article plus implementation code, this article is the second one.
Distributed tracking
What is distributed tracing
Distributed Systems
When we use Google or Baidu search, the query service will distribute keywords to multiple query servers, each server searches within its own index range, and the search engine can obtain a large number of accurate search results in a short time; at the same time, According to the keywords, the advertising subsystem will push appropriate relevant advertisements, and the website weight will be obtained from the bidding ranking subsystem. Usually, a search may require thousands of servers to participate, and it needs to provide services through many different systems.
Many computers form a huge system through the network, and this system is a distributed system.
In microservices or cloud-native development, it is generally considered that distributed systems are connected through various middleware/service grids. These middleware provide shared resources, functions (APIs, etc.), files, etc., so that the entire network can be used as A computer for work.
Distributed tracking
In a distributed system, a user's request will be distributed to multiple subsystems, processed by different services, and finally returned to the user. The period between the user sending the request and obtaining the result is a request cycle.
When we shop, we only need a very simple process:
Get coupons -> place an order -> pay -> wait for receiptHowever, in the background system, each link needs to go through multiple subsystems for collaboration, and there are strict processes. For example, when placing an order, you need to check whether there is a coupon, whether the coupon can be used for the current product, whether the current order meets the conditions for using the coupon, etc.
The following figure is a flow of the system processing the request after a user request.
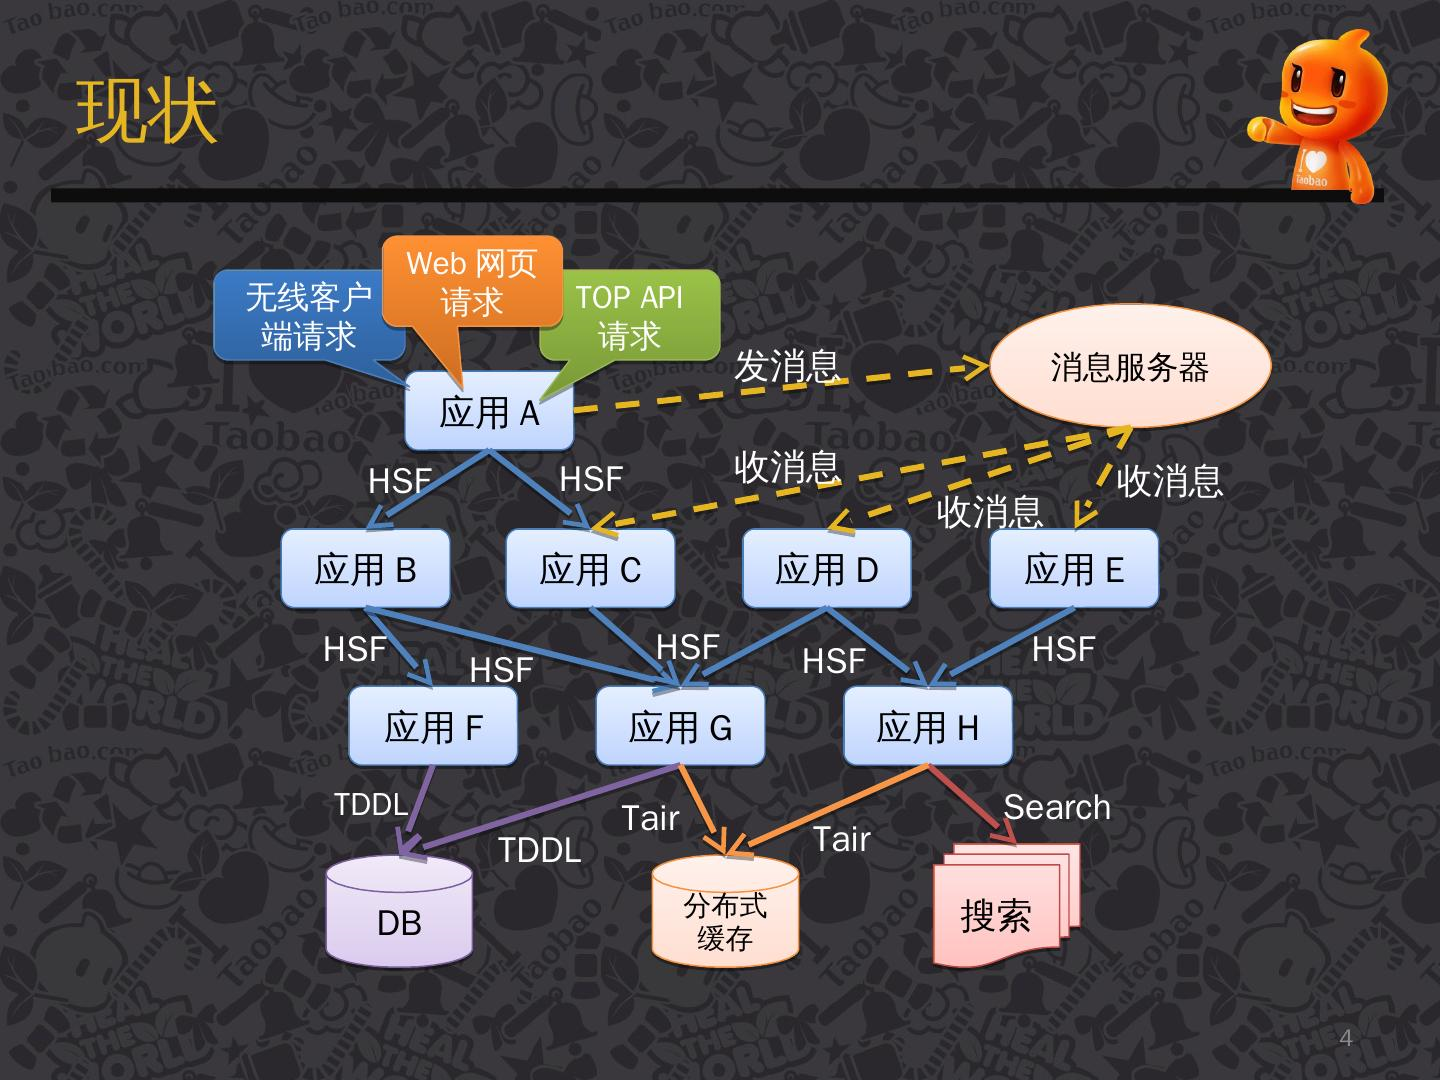
[Image source: [Introduction to Taobao Distributed Call Tracking System under Eagle Eyes] (https://www.slidestalk.com/u36/k21g5i)]
There are many arrows in the figure, these arrows point to the next service/subsystem that will flow through, and these arrows form a link network.
In a complex distributed system, the poor performance of any subsystem will affect the entire request cycle. According to the picture above, we envision:
-
The system may add new services or delete old services every day, or it may be upgraded. When the system has errors, how do we locate the problem?
-
When the user requests, the response is slow, how to locate the problem?
-
The service may be developed by different programming languages. Is the method of 1, 2 positioning the problem suitable for all programming languages?
What is the use of distributed tracing?
With the rise of microservices and cloud-native development, more and more applications are developed on a distributed basis, but after large-scale applications are split into microservices, the dependencies and calls between services become more and more complicated. These services are different Teams, developed in different languages and deployed on different machines, may provide different interfaces between them (gRPC, Restful api, etc.).
In order to maintain these services, the Observability idea appeared in the software field. In this idea, the maintenance of microservices is divided into three parts:
- Metrics (
Metrics): used for monitoring and alarm; - Distributed tracing (Tracing): used to record all tracing information in the system;
- Logging: Record the discrete information of each service;
These three parts are not independent. For example, Metrics can monitor whether the Tracing and Logging services are running normally. Tacing and Metrics services will generate logs during operation.
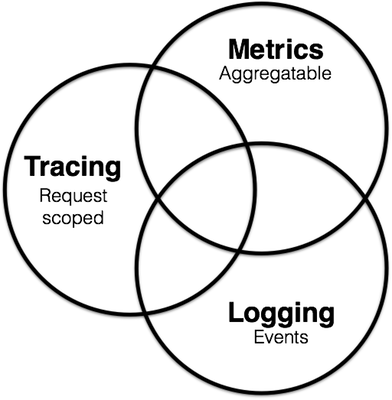
To learn more, please poke your screen: [https://peter.bourgon.org/blog/2017/02/21/metrics-tracing-and-logging.html](https://peter.bourgon.org/blog /2017/02/21/metrics-tracing-and-logging.html)
In recent years, the APM system has emerged. APM is called an application performance management system, which can perform software performance monitoring and performance analysis. APM is a kind of Metrics, but now there is a trend of integrating Tracing.
Back to the topic, what is the use of a distributed tracing system (Tracing)? Here is an example of Jaeger, which can:
-Distributed tracking information transfer
-Distributed transaction monitoring
-Service dependency analysis
-Show cross-process call chain
-Location problem
-Performance optimization
Jaeger needs to analyze results in conjunction with the backend. Jaeger has a Jaeger UI, but it does not have many functions. Therefore, it also needs to rely on the Metrics framework to visualize the results from the presentation, as well as custom monitoring and alarm rules, so it is natural that Metrics may incorporate Tracing Things have been done.
Dapper
Dapper is a distributed link tracing system used internally by Google. It is not open source. However, Google has released a "Dapper, a Large-Scale Distributed Systems Tracing Infrastructure" paper. This paper describes the theory and Dapper's design ideas.
There are many link tracking systems based on Dapper papers, such as Taobao's Hawkeye, Twitter's Zipkin, Uber's open source Jaeger, and the distributed link tracking standard OpenTracing.
Paper address:
[https://static.googleusercontent.com/media/research.google.com/en//archive/papers/dapper-2010-1.pdf](https://static.googleusercontent.com/media/research.google .com/en//archive/papers/dapper-2010-1.pdf)
Translation:
http://bigbully.github.io/Dapper-translation/
If you can’t access github.io, you can clone the warehouse to see [https://github.com/bigbully/Dapper-translation/tree/gh-pages](https://github.com/bigbully/Dapper-translation/tree/ gh-pages)
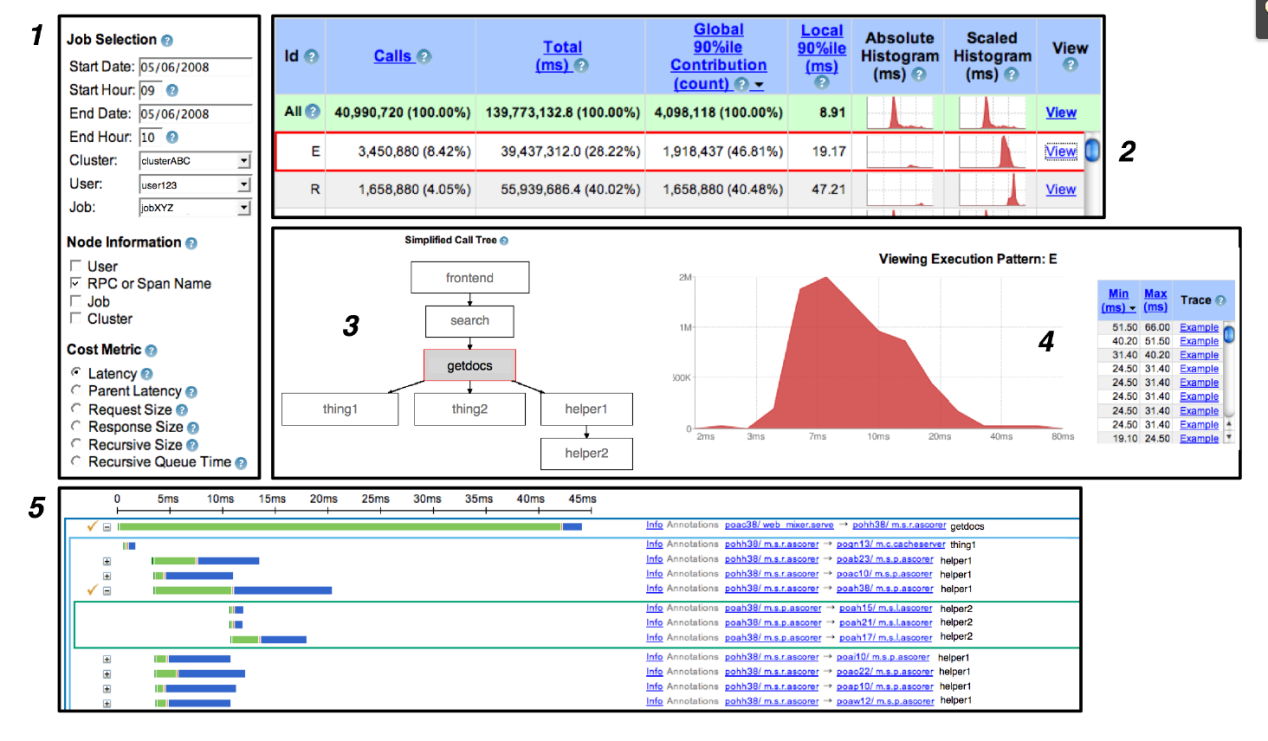
Dapper user interface:
Implementation of Distributed Tracking System
The following figure is a distributed system initiated by user X and traverses multiple services. A, B, C, D, and E represent different subsystems or processes.
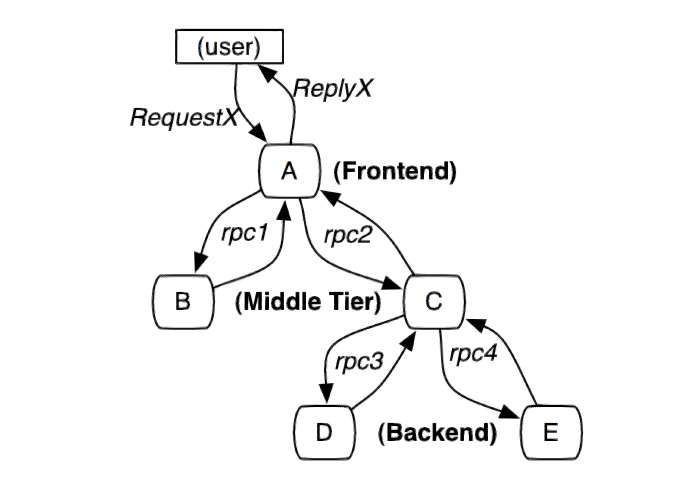
In this figure, A is the front end, B and C are the middle layer, and D and E are the back end of C. These subsystems are connected through the rpc protocol, such as gRPC.
A simple and practical implementation of a distributed link tracking system is to collect message identifiers and timestamped events for every request and response on the server.
The tracking system of distributed services needs to record information about all the work completed in the system after a specific request. User requests can be parallel. There may be a large number of actions to be processed at the same time. A request will also go through multiple services in the system. Various tracking information is generated in the system all the time. A request must be placed in different services. The generated tracking information is linked.
In order to associate all record entries with a given initiator X and record all information, there are currently two solutions, black-box and annotation-based monitoring solutions.
Black box solution:
Assuming that there is no additional information other than the above information that needs to be tracked, statistical regression techniques are used to infer the relationship between the two.
Annotation-based solution:
Rely on the application or middleware to clearly mark a global ID to connect each record with the request of the initiator.
Advantages and disadvantages:
Although black box schemes are lighter than labeling schemes, they require more data to obtain sufficient accuracy because they rely on statistical inference. The main disadvantage of the annotation-based solution is that it obviously requires code implantation. In our production environment, because all applications use the same threading model, control flow and RPC system, we found that we can limit the code implantation to a small common component library, thus realizing the monitoring system The application is effectively transparent to developers.
Dapper is an annotation-based solution. Next, we will introduce some conceptual knowledge in Dapper.
Trace tree and span
From a formal point of view, the Dapper tracking model uses a tree structure, Span and Annotation.
In the previous picture, we can see that the entire request network is a tree structure, and user requests are the root node of the tree. In Dapper's tracking tree structure, tree nodes are the basic unit of the entire architecture.
A span is called a span. The process of a node receiving a request and completing the request is a span. The span records various information generated in this process. When each node processes each request, it will generate a unique span id. When A -> C -> D, multiple consecutive spans will have a parent-child relationship. Then a span needs to be associated in addition to saving its own span id. Father and son span id. Span id generation must be high-performance, and can clearly indicate the time sequence, which will be introduced when Jaeger is introduced later.
Annotation is translated into annotation. In a span, you can add more tracking details to the span. These additional information can help us monitor the behavior of the system or help debug problems. Annotation can add any content.
So far, I have briefly introduced some distributed tracing and Dapper knowledge, but these are not enough to rigorously explain the knowledge and concepts of distributed tracing. It is recommended that readers read Dapper theory when they have time.文。
要实现 Dapper,还需要代码埋点、采样、跟踪收集等,这里就不再细谈了,后面会介绍到,读者也可以看看论文。
Jaeger 和 OpenTracing
OpenTracing
OpenTracing 是与分布式系统无关的API和用于分布式跟踪的工具,它不仅提供了统一标准的 API,还致力于各种工具,帮助开发者或服务提供者开发程序。
OpenTracing 为标准 API 提供了接入 SDK,支持这些语言:Go, JavaScript, Java, Python, Ruby, PHP, Objective-C, C++, C#。
当然,我们也可以自行根据通讯协议,自己封装 SDK。
读者可以参考 OpenTracing 文档:https://opentracing.io/docs/
接下来我们要一点点弄清楚 OpenTracing 中的一些概念和知识点。由于 jaeger 是 OpenTracing 最好的实现,因此后面讲 Jaeger 就是 Opentracing ,不需要将两者严格区分。
Jaeger 结构
首先是 JAEGER 部分,这部分是代码埋点等流程,在分布式系统中处理,当一个跟踪完成后,通过 jaeger-agent 将数据推送到 jaeger-collector。jaeger-collector 负责处理四面八方推送来的跟踪信息,然后存储到后端,可以存储到 ES、数据库等。Jaeger-UI 可以将让用户在界面上看到这些被分析出来的跟踪信息。
OpenTracing API 被封装成编程语言的 SDK(jaeger-client),例如在 C# 中是 .dll ,Java 是 .jar,应用程序代码通过调用 API 实现代码埋点。
jaeger-Agent 是一个监听在 UDP 端口上接收 span 数据的网络守护进程,它会将数据批量发送给 collector。
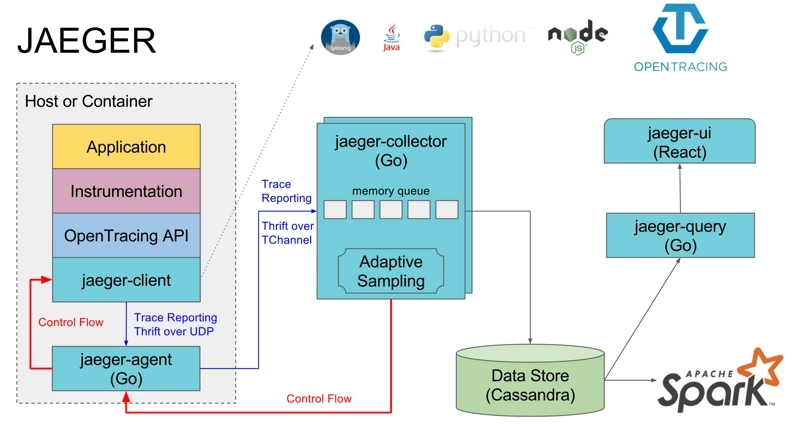
【图片来源:https://segmentfault.com/a/1190000011636957】
OpenTracing 数据模型
在 OpenTracing 中,跟踪信息被分为 Trace、Span 两个核心,它们按照一定的结构存储跟踪信息,所以它们是 OpenTracing 中数据模型的核心。
Trace 是一次完整的跟踪,Trace 由多个 Span 组成。下图是一个 Trace 示例,由 8 个 Span 组成。
        [Span A]  ←←←(the root span)
            |
     +------+------+
     |             |
 [Span B]      [Span C] ←←←(Span C is a `ChildOf` Span A)
     |             |
 [Span D]      +---+-------+
               |           |
           [Span E]    [Span F] >>> [Span G] >>> [Span H]
                                       ↑
                                       ↑
                                       ↑
                         (Span G `FollowsFrom` Span F)
Tracing:
a Trace can be thought of as a directed acyclic graph (DAG) of Spans。
有点难翻译,大概意思是 Trace 是多个 Span 组成的有向非循环图。
在上面的示例中,一个 Trace 经过了 8 个服务,A -> C -> F -> G 是有严格顺序的,但是从时间上来看,B 、C 是可以并行的。为了准确表示这些 Span 在时间上的关系,我们可以用下图表示:
––|–––––––|–––––––|–––––––|–––––––|–––––––|–––––––|–––––––|–> time

 [Span A···················································]
   [Span B··············································]
      [Span D··········································]
    [Span C········································]
         [Span E·······]        [Span F··] [Span G··] [Span H··]
有个要注意的地方, 并不是 A -> C -> F 表示 A 执行结束,然后 C 开始执行,而是 A 执行过程中,依赖 C,而 C 依赖 F。因此,当 A 依赖 C 的过程完成后,最终回到 A 继续执行。所以上图中 A 的跨度最大。
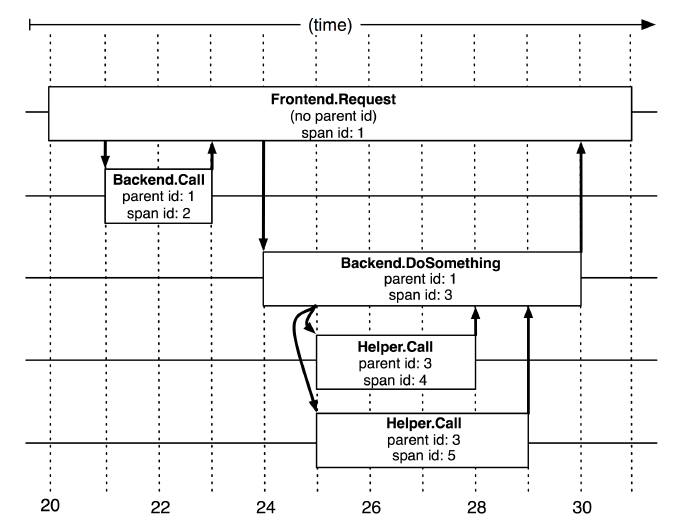
Span 格式
要深入学习,就必须先了解 Span,请读者认真对照下面的图片和 Json:
json 地址: https://github.com/whuanle/DistributedTracing/issues/1
后续将围绕这张图片和 Json 来举例讲述 Span 相关知识。
Trace
一个简化的 Trace 如下:
注:不同编程语言的字段名称有所差异,gRPC 和 Restful API 的格式也有所差异。
            "traceID": "790e003e22209ca4",
            "spans":[...],
            "processes":{...}
前面说到,在 OpenTracing 中,Trace 是一个有向非循环图,那么 Trace 必定有且只有一个起点。
这个起点会创建一个 Trace 对象,这个对象一开始初始化了 trace id 和 process,trace id 是一个 32 个长度的字符串组成,它是一个时间戳,而 process 是起点进程所在主机的信息。
下面笔者来说一些一下 trace id 是怎么生成的。trace id 是 32个字符串组成,而实际上只使用了 16 个,因此,下面请以 16 个字符长度去理解这个过程。
首先获取当前时间戳,例如获得 1611467737781059 共 16 个数字,单位是微秒,表示时间 2021-01-24 13:55:37,秒以下的单位这里就不给出了,明白表示时间就行。
在 C# 中,将当前时间转为这种时间戳的代码:
        public static long ToTimestamp(DateTime dateTime)
        {
            DateTime dt1970 = new DateTime(1970, 1, 1, 0, 0, 0, 0);
            return (dateTime.Ticks - dt1970.Ticks)/10;
        }

// 结果:1611467737781059
如果我们直接使用 Guid 生成或者 string 存储,都会消耗一些性能和内存,而使用 long,刚刚好可以表示时间戳,还可以节约内存。
获得这个时间戳后,要传输到 Jaeger Collector,要转为 byet 数据,为什么要这样不太清楚,按照要求传输就是了。
将 long 转为一个 byte 数组:
            var bytes = BitConverter.GetBytes(time);
            // 大小端
            if (BitConverter.IsLittleEndian)
            {
                Array.Reverse(bytes);
            }
long 占 8 个字节,每个 byte 值如下:
0x00 0x05 0xb9 0x9f 0x12 0x13 0xd3 0x43然后传输到 Jaeger Collector 中,那么获得的是一串二进制,怎么表示为字符串的 trace id?
可以先还原成 long,然后将 long 输出为 16 进制的字符串:
转为字符串(这是C#):
Console.WriteLine(time.ToString("x016"));结果:
0005b99f1213d343Span id 也是这样转的,每个 id 因为与时间戳相关,所以在时间上是唯一的,生成的字符串也是唯一的。
这就是 trace 中的 trace id 了,而 trace process 是发起请求的机器的信息,用 Key-Value 的形式存储信息,其格式如下:
                        {
                            "key": "hostname",
                            "type": "string",
                            "value": "Your-PC"
                        },
                        {
                            "key": "ip",
                            "type": "string",
                            "value": "172.6.6.6"
                        },
                        {
                            "key": "jaeger.version",
                            "type": "string",
                            "value": "CSharp-0.4.2.0"
                        }
Ttace 中的 trace id 和 process 这里说完了,接下来说 trace 的 span。
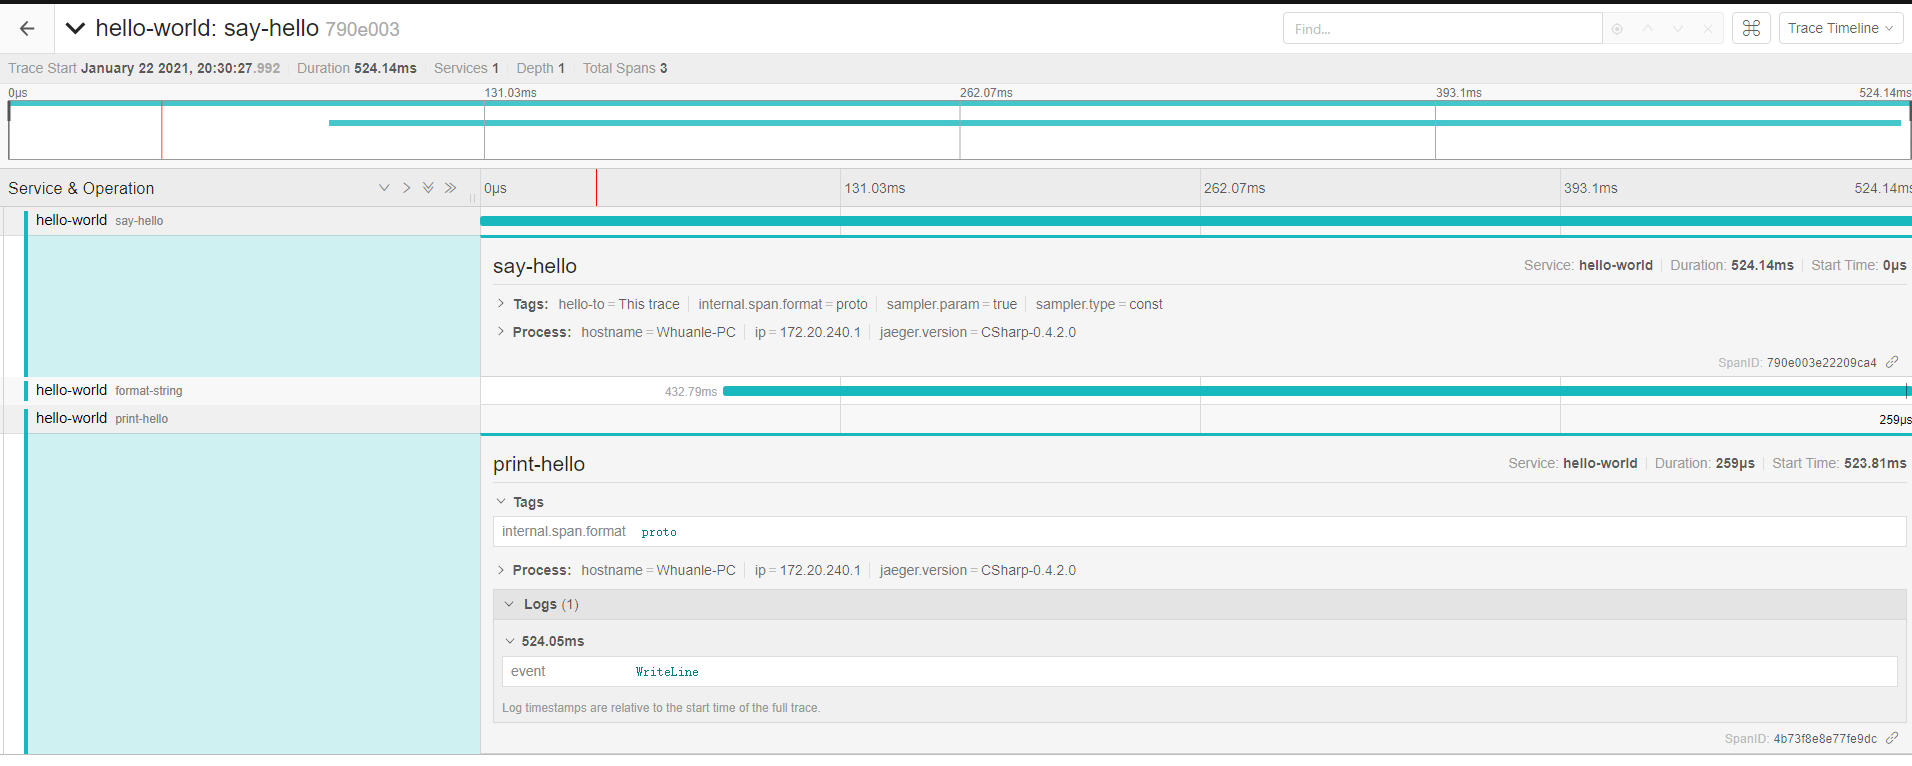
Span
SpanIt consists of the following information:
- An operation name: operation name, must have;
- A start timestamp: start timestamp, must have;
- A finish timestamp: end timestamp, must have;
- Span Tags.: Key-Value format represents the requested tag, optional;
- Span Logs: Key-Value format, to record simple and structured logs, must be of string type, optional;
- SpanContext: Span context, pass in different spans to establish relationships;
- References t: other Span referenced;
If there is a parent-child relationship between spans, you can use SpanContext to bind this relationship. The parent-child relationship has ChildOf and FollowsFrom. ChildOf means that the parent Span depends on the child Span to a certain extent, and FollowsFrom means the parent Span is completely independent of the results of its child Span.
The simplified information of a Span is as follows (don't care about the case of field names):
{
                    "traceID": "790e003e22209ca4",
                    "spanID": "4b73f8e8e77fe9dc",
                    "flags": 1,
                    "operationName": "print-hello",
                    "references": [],
                    "startTime": 1611318628515966,
                    "duration": 259,
                    "tags": [
                        {
                            "key": "internal.span.format",
                            "type": "string",
                            "value": "proto"
                        }
                    ],
                    "logs": [
                        {
                            "timestamp": 1611318628516206,
                            "fields": [
                                {
                                    "key": "event",
                                    "type": "string",
                                    "value": "WriteLine"
                                }
                            ]
                        }
                    ]
}
OpenTracing API
In the OpenTracing API, there are three main objects:
- Tracer
- Span
- SpanContext
Tracer can create Spans and learn how to Inject (serialize) and Extract (deserialize) their metadata across process boundaries. It has the following functions:
-Start a new Span
-Inject a SpanContext to a carrier
-Extract a SpanContext from the carrier
A Tracer is created by the starting process, and then the process is started to initiate a request. Each action generates a Span. If there is a parent-child relationship, Tracer can associate them. When the request is completed, Tracer will push the trace information to Jaeger-Collector.
For details, please refer to the document: https://opentracing.io/docs/overview/tracers/
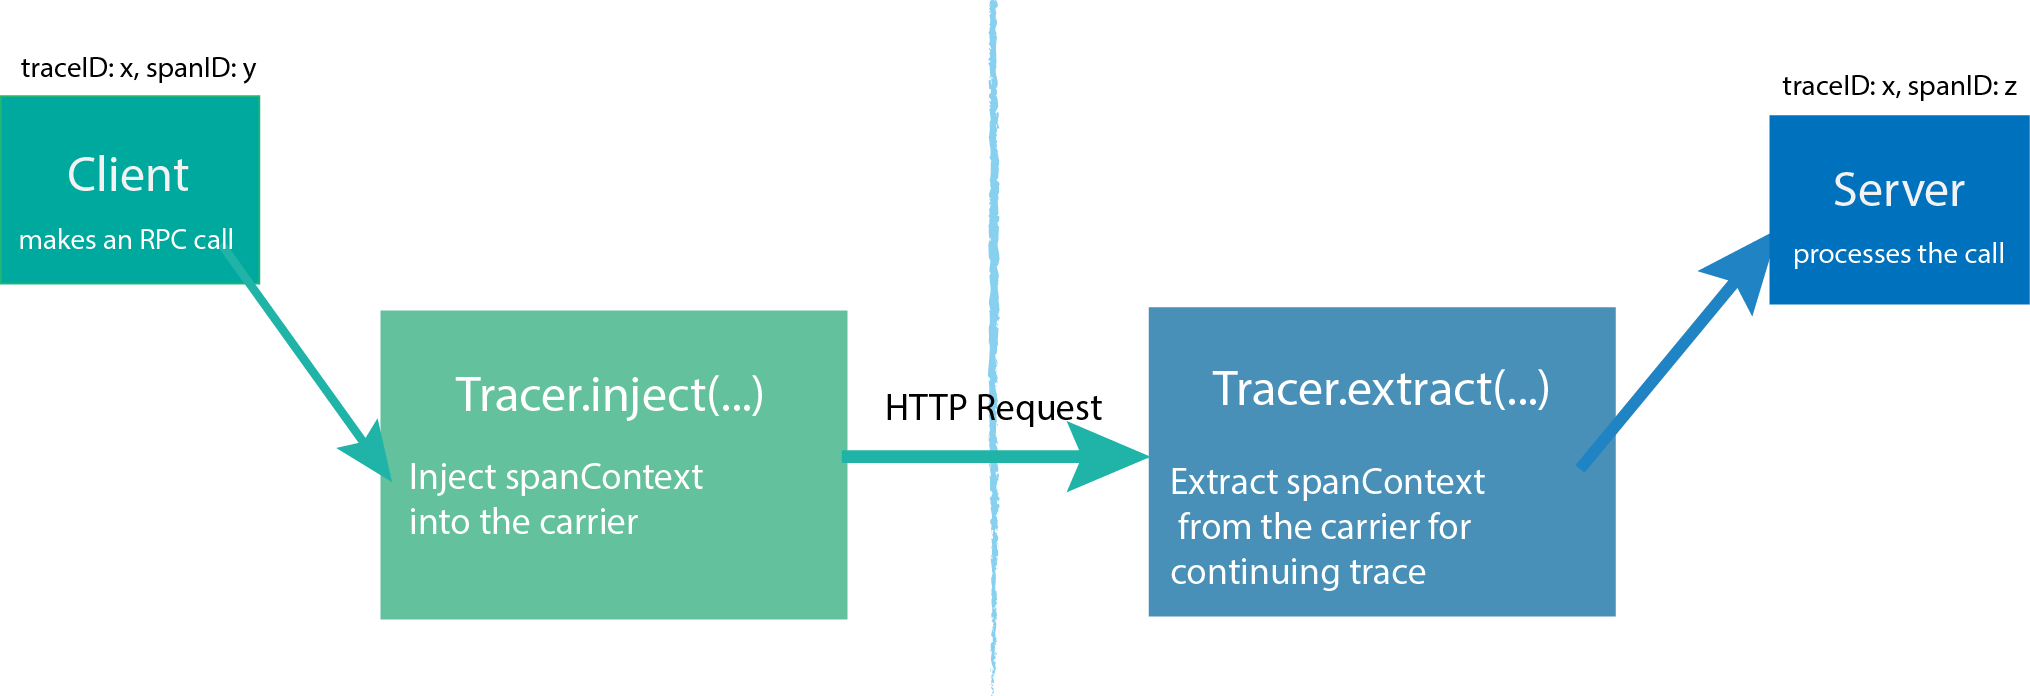
SpanContext transmits information in different Spans, and SpanContext contains simple Trace id, Span id and other information.
We continue the following figure as an example to explain.
A creates a Tracer, then creates a Span to represent itself (A), and then creates two Spans to represent B and C respectively, and then pass some information to B and C through SpanContext; after B and C receive A’s message, they also Create a Tracer to use Tracer.extract(...); where B has no follow-up and can return the result directly; while Tracer of C continues to create two Spans, passing SpanContext to D and E.
This process is more complicated, and the author is not good at it. Readers are advised to participate in the official documentation of OpenTracing.
With the detailed OpenTracing API, you can learn how to use various APIs when writing corresponding services in programming languages.
The author of .NET Core wrote an article, readers who are interested can read: [Logs and Distributed Link Tracking in .NET Core][https://www.cnblogs.com/whuanle/p/14256858.html](https ://www.cnblogs.com/whuanle/p/14256858.html)

文章评论