Log and distributed link tracking in .NET Core
The log recorded by the program generally has two functions: troubleshooting and explicit program running status. When a program fails, we can locate the problem through the log, and the log can give us a basis for troubleshooting. In many cases, it is often thought that log records are very simple. For example, many programs are just try-catch{} and output directly to .txt, but these logs often fail to help locate the problem, and even the logs are full of garbage. Content: The content of the log is scanned by the human eye line by line, or searched by Ctrl+F, which cannot efficiently review the log; the log is simply output to a text file, and the log is not well managed.
Next, we will learn log writing skills step by step, as well as OpenTracing API, Jaeger distributed link tracing related knowledge.
Logs in .NET Core
Console output
The simplest log is console output, using the Console.WriteLine() function to directly output information.
The following is a simple message output. When the program calls the SayHello function, SayHello will print the message.
    public class Hello
    {
        public void SayHello(string content)
        {
            var str = $"Hello,{content}";
            Console.WriteLine(str);
        }
    }

    class Program
    {
        static void Main(string[] args)
        {
            Hello hello = new Hello();
            hello.SayHello("any one");
            Console.Read();
        }
    }
Non-intrusive logging
Through the console, we can see that in order to record the log, we must write the code to enter the log in the function. The advantages and disadvantages will not be mentioned. We can implement aspect programming through the AOP framework and record the same log.
Here you can use the author's open source CZGL.AOP framework, which can be searched in Nuget.

Write a unified cut-in code that will be executed when the function is called.
Before will take effect before the proxy method is executed or when the proxy property is called. You can get and modify the passed parameters through the AspectContext context.
After takes effect after the method is executed or when the property is called. You can get and modify the return value through the context.
    public class LogAttribute: ActionAttribute
    {
        public override void Before(AspectContext context)
        {
            Console.WriteLine($"{context.MethodInfo.Name} before the function is executed");
        }

        public override object After(AspectContext context)
        {
            Console.WriteLine($"{context.MethodInfo.Name} after the function is executed");
            return null;
        }
    }
Transform the Hello class, the code is as follows:
    [Interceptor]
    public class Hello
    {
        [Log]
        public virtual void SayHello(string content)
        {
            var str = $"Hello,{content}";
            Console.WriteLine(str);
        }
    }
Then create the proxy type:
        static void Main(string[] args)
        {
            Hello hello = AopInterceptor.CreateProxyOfClass<Hello>();
            hello.SayHello("any one");
            Console.Read();
        }
Start the program, it will output:
Before the SayHello function is executed
Hello, any one
After the SayHello function is executed
You don't need to worry about the AOP framework will bring performance problems to your program, because the CZGL.AOP framework is written in EMIT and has its own cache. When a type is proxied, there is no need to regenerate it afterwards.
CZGL.AOP can be used in conjunction with Autofac through the dependency injection framework that comes with .NET Core to automatically proxy the services in the CI container. There is no need for AopInterceptor.CreateProxyOfClass to manually call the proxy interface.
The CZGL.AOP code is open source, you can refer to another blog post by the author:
https://www.cnblogs.com/whuanle/p/13160139.html
Microsoft.Extensions.Logging
Some companies have no technical management specifications, and different developers use different log frameworks. There may be .txt, NLog, Serilog, etc. in a product, and there is no same package.
There are many logging components in .NET Core, but popular logging frameworks basically implement Microsoft.Extensions.Logging.Abstractions, so we can learn Microsoft.Extensions.Logging. Microsoft.Extensions.Logging.Abstractions is the official abstraction of log components. If a log component does not support Microsoft.Extensions.Logging.Abstractions, then this component is easy to integrate with the project, and it is difficult to modularize and reduce coupling in the future. degree.
The Microsoft.Extensions.Logging package contains Logging APIs. These Logging APIs cannot run independently. It is used with one or more logging providers that store or display logs to specific output, such as Console, Debug, TraceListeners.
The following figure is the hierarchical structure of Loggin API in .NET Core:
Image source: https://www.tutorialsteacher.com/
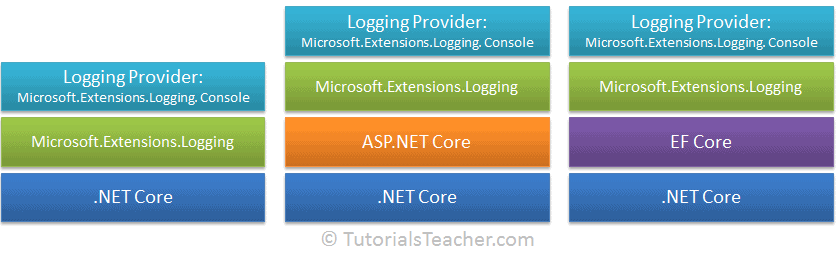
To be honest, Microsoft.Extensions.Logging was very confused at first, and the configuration felt very complicated. Therefore, it is important to have a clear structure diagram to help you understand the Logging API inside.
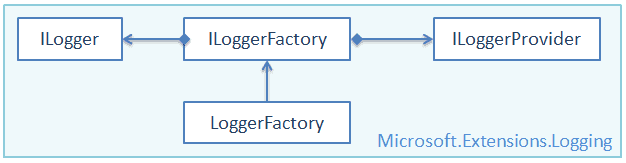
ILoggerFactory
Many standard interfaces in .NET Core practice the idea of the factory pattern. ILoggerFactory is the interface of the factory pattern, and LoggerFactory is the realization of the factory pattern.
Its definition is as follows:
public interface ILoggerFactory: IDisposable
{
    ILogger CreateLogger(string categoryName);
    void AddProvider(ILoggerProvider provider);
}
The role of the ILoggerFactory factory interface is to create an instance of the ILogger type, which is the CreateLogger interface.
ILoggerProvider
You can create your own logging provider by implementing the ILoggerProvider interface, indicating the type of ILogger instance that can be created.
Its definition is as follows:
public interface ILoggerProvider: IDisposable
{
    ILogger CreateLogger(string categoryName);
}
ILogger
The ILogger interface provides a method to record logs to basic storage, which is defined as follows:
public interface ILogger
{
    void Log<TState>(LogLevel logLevel,entId,
                     TState state,
                     Exception exception,
                     Func<TState, Exception, string> formatter);

    bool IsEnabled(LogLevel logLevel);
    IDisposable BeginScope<TState>(TState state);
}
Logging Providers
logging providers are called logging programs.
Logging Providers display or store logs to specific media, such as console, debugging event, event log, trace listener, etc.
Microsoft.Extensions.Logging provides the following types of logging providers, which we can get through Nuget.
- Microsoft.Extensions.Logging.Console
- Microsoft.Extensions.Logging.AzureAppServices
- Microsoft.Extensions.Logging.Debug
- Microsoft.Extensions.Logging.EventLog
- Microsoft.Extensions.Logging.EventSource
- Microsoft.Extensions.Logging.TraceSource
And Serilog has File, Console, Elasticsearch, Debug, MSSqlServer, Email, etc.
There are many of these log providers, we don't need to go into details; if a log component does not provide an implementation compatible with Microsoft.Extensions.Logging, then it should not be introduced at all.
In fact, many programs are directly File.Write("Log.txt"), how can the quality of this product be better?
how to use
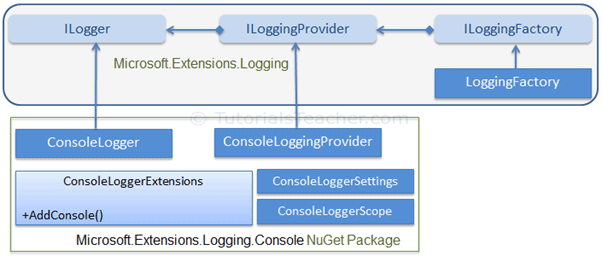
Earlier, the composition of Microsoft.Extensions.Logging was introduced. Here, we will learn how to use Logging Provider to input logs.
At least it is mentioned that it only provides a Logging API, so in order to output logs, we must choose a suitable Logging Provider program, here we choose
Microsoft.Extensions.Logging.Console, please refer to this package in Nuget.
The following figure is the structure diagram of the combination of Logging Provider and ConsoleLogger:
From the conventional method, the author found that there is no way to configure it. . .
            ConsoleLoggerProvider consoleLoggerProvider = new ConsoleLoggerProvider(
                new OptionsMonitor<ConsoleLoggerOptions>(
                    new OptionsFactory<ConsoleLoggerOptions>(
                        new IEnumerable<IConfigureOptions<TOptions>(... ... ...))));
So you can only use the following code to quickly create a factory:
            using ILoggerFactory loggerFactory =
                LoggerFactory.Create(builder =>
                    builder.AddSimpleConsole(options =>
                    {
                        options.IncludeScopes = true;
                        options.SingleLine = true;
                        options.TimestampFormat = "hh:mm:ss ";
                    }));
or:
ILoggerFactory loggerFactory = LoggerFactory.Create(builder => builder.AddConsole());Of course, other log providers can be added to the factory, example:
            using ILoggerFactory loggerFactory =
                LoggerFactory.Create(builder =>
                    builder.AddSimpleConsole(...)
                    .AddFile(...)
                    .Add()...
                    );
Then get the ILogger instance:
ILogger logger = loggerFactory.CreateLogger<Program>();Record log:
logger.LogInformation("Log Information");Log Level
In the Logging API, seven log levels are defined, which are defined as follows:
public enum LogLevel
{
  Debug = 1,
  Verbose = 2,
  Information = 3,
  Warning = 4,
  Error = 5,
  Critical = 6,
  None = int.MaxValue
}
We can output logs of the following levels through the functions in ILogger:
            logger.LogInformation("Logging information.");
            logger.LogCritical("Logging critical information.");
            logger.LogDebug("Logging debug information.");
            logger.LogError("Logging error information.");
            logger.LogTrace("Logging trace");
            logger.LogWarning("Logging warning.");
Regarding Microsoft.Extensions.Logging, I won't repeat it here. Readers can level the following links to learn more about related knowledge:
https://www.tutorialsteacher.com/core/fundamentals-of-logging-in-dotnet-core
Trace, Debug
The namespace of the Debug and Trace classes is System.Diagnostics. Debug and Trace provide a set of methods and properties that help debug code.
Readers can refer to another article of the author:
https://www.cnblogs.com/whuanle/p/14141213.html#3
Output to the console:
Trace.Listeners.Add(new TextWriterTraceListener(Console.Out));
Debug.WriteLine("Information");
Link tracking
Link tracing can help developers quickly locate performance bottlenecks under distributed application architecture, and improve the efficiency of development and diagnosis in the era of microservices.
OpenTracing
The Trace and Debug mentioned earlier are APIs provided to developers in .NET Core for diagnosing programs and outputting information, and the trace mentioned later is only the link tracing (trace) in the OpenTracing API.
Ordinary logging has a big disadvantage, that is, each method records a log, and we cannot associate multiple methods called in a process. When a method is abnormal, it is difficult for us to know which task process is abnormal. We can only see which method has an error, and its caller.
In OpenTracing, Trace is a directed acyclic graph with Span. A Span represents a logical representation of some work done in the application. Each Span has the following properties:
- Operation name
- Starting time
- End Time
In order to figure out what Trace and Span are, and what is OpenTracing, please introduce OpenTracing in Nuget.
Write the Hello class as follows:
    public class Hello
    {
        private readonly ITracer _tracer;
        private readonly ILogger<Hello> _logger;
        public Hello(ITracer tracer, ILoggerFactory loggerFactory)
        {
            _tracer = tracer;
            _logger = loggerFactory.CreateLogger<Hello>();
        }

        public void SayHello(string content)
        {
            // Create a Span and start
            var spanBuilder = _tracer.BuildSpan("say-hello");
            // -------------------------------
            var span = spanBuilder.Start(); // |
            var str = $"Hello,{content}"; // |
            _logger.LogInformation(str); // |
            span.Finish(); // |
            // ---------------------------------
        }
    }```

Start the program and start tracking:

```csharp
        static void Main(string[] args)
        {
            using ILoggerFactory loggerFactory = LoggerFactory.Create(builder => builder.AddConsole());

            Hello hello = new Hello(GlobalTracer.Instance, loggerFactory);
            hello.SayHello("This trace");
            Console.Read();
        }
In the above process, we used the OpenTracing API. Below is an explanation of some elements in the code:
- ITracer is an instance of link tracking, BuildSpan() can create one of the Span;
- Each ISpan has an operation name, such as `say-hello`;
- Use `Start()` to start a Span; use `Finish()` to end a Span;
- The tracking program will automatically record the time stamp;
Of course, when we run the above program, there is no other information and UI interface. This is because `GlobalTracer.Instance` will return a no-operation tracer. When we define a Tracer, we can observe the process of link tracing.
In Nuget, `Jaeger` is introduced.
In Program, add a static function, this function returns a custom Tracer:
private static Tracer InitTracer(string serviceName, ILoggerFactory loggerFactory)
{
    var samplerConfiguration = new Configuration.SamplerConfiguration(loggerFactory)
        .WithType(ConstSampler.Type)
        .WithParam(1);

    var reporterConfiguration = new Configuration.ReporterConfiguration(loggerFactory)
        .WithLogSpans(true);

    return (Tracer)new Configuration(serviceName, loggerFactory)
        .WithSampler(samplerConfiguration)
        .WithReporter(reporterConfiguration)
        .GetTracer();
}
Modify the content of the Main function as follows:
        static void Main(string[] args)
        {
            using ILoggerFactory loggerFactory = LoggerFactory.Create(builder => builder.AddConsole());
            var tracer = InitTracer("hello-world", loggerFactory);
            Hello hello = new Hello(tracer, loggerFactory);
            hello.SayHello("This trace");
            Console.Read();
        }
Complete code: https://gist.github.com/whuanle/b57fe79c9996988db0a9b812f403f00e
Context and tracking features
However, the log output string directly is very unfriendly, at this time, we need to structure the log.
Of course, ISpan provides a structured log method, we can write a method for formatting the log.
Tracking a single function
Add the following code in the Hello class:
private string FormatString(ISpan rootSpan, string helloTo)
{
    var span = _tracer.BuildSpan("format-string").Start();
    try
    {
        var helloString = $"Hello, {helloTo}!";
        span.Log(new Dictionary
        {
            [LogFields.Event] = "string.Format",
            ["value"] = helloString
        });
        return helloString;
    }
    finally
    {
        span.Finish();
    }
}
In addition, we can also encapsulate a function that outputs string information:
private void PrintHello(ISpan rootSpan, string helloString)
{
    var span = _tracer.BuildSpan("print-hello").Start();
    try
    {
        _logger.LogInformation(helloString);
        span.Log("WriteLine");
    }
    finally
    {
        span.Finish();
    }
}
Change the SayHello method to:
        public void SayHello(string content)
        {
            var spanBuilder = _tracer.BuildSpan("say-hello");
            var span = spanBuilder.Start();
            var str = FormatString(span, content);
            PrintHello(span,str);
            span.Finish();
        }
The reason for changing the above code is not to mix too much code in one method, you can try to reuse some code to encapsulate a unified code.
However, originally we only need to call the SayHello method, here one method will continue to call the other two methods. It was originally one Span, and finally became three Span.
info: Jaeger.Configuration[0]
info: Jaeger.Reporters.LoggingReporter[0]
      Span reported: 77f1a24676a3ffe1:77f1a24676a3ffe1:0000000000000000:1-format-string
info: ConsoleApp1.Hello[0]
      Hello, This trace!
info: Jaeger.Reporters.LoggingReporter[0]
      Span reported: cebd31b028a27882:cebd31b028a27882:0000000000000000:1-print-hello
info: Jaeger.Reporters.LoggingReporter[0]
      Span reported: 44d89e11c8ef51d6:44d89e11c8ef51d6:0000000000000000:1-say-hello
Note: `0000000000000000` means that a Span has ended.
Advantages: From the code point of view, SayHello -> FormaString, SayHello -> PrintHello, we can clearly know the call link;
Disadvantages: From the output point of view, Span reported is different, we cannot judge the causality of the three functions in the output;
It is impossible for us to stare at the code all the time, and it is impossible for operation and maintenance personnel and implementation personnel to compare and find code logic with the code.
Combine multiple spans into one track
ITracer is responsible for creating link tracking, so ITracer also provides an API that combines the causality of multiple spans.
The method of use is as follows:
var rootSapn = _tracer.BuildSpan("say-hello"); // A
var span = _tracer.BuildSpan("format-string").AsChildOf(rootSpan).Start(); // B
// A -> B
We create a rootSpan and then create a `sapn` that continues rootSpan, `rootSpan -> span`.
info: Jaeger.Reporters.LoggingReporter[0]
      Span reported: 2f2c7b36f4f6b0b9:3dab62151c641380:2f2c7b36f4f6b0b9:1-format-string
info: ConsoleApp1.Hello[0]
      Hello, This trace!
info: Jaeger.Reporters.LoggingReporter[0]
      Span reported: 2f2c7b36f4f6b0b9:9824227a41539786:2f2c7b36f4f6b0b9:1-print-hello
info: Jaeger.Reporters.LoggingReporter[0]
      Span reported: 2f2c7b36f4f6b0b9:2f2c7b36f4f6b0b9:0000000000000000:1-say-hello
Span reported: 2f2c7b36f4f6b0b9The output order is the order of execution, and say-hello is executed last.
Context in the communication process
From what code, everyone found that the code is more troublesome because:
- To pass the Span object as the first parameter to each function;
- Add lengthy `try-finally{}` in each function to ensure that the Span can be completed
To this end, the OpenTracing API provides a better method. We can avoid passing Span as a parameter to the code, and we can call _tracer uniformly.
Modify the `FormatString` and `PrintHello` codes as follows:
    private string FormatString(string helloTo)
    {
        using var scope = _tracer.BuildSpan("format-string").StartActive(true);
        var helloString = $"Hello, {helloTo
                     EventId ev}!";
        scope.Span.Log(new Dictionary
        {
            [LogFields.Event] = "string.Format",
            ["value"] = helloString
        });
        return helloString;
    }

    private void PrintHello(string helloString)
    {
        using var scope = _tracer.BuildSpan("print-hello").StartActive(true);
        _logger.LogInformation(helloString);
        scope.Span.Log(new Dictionary
        {
            [LogFields.Event] = "WriteLine"
        });
    }
Modify the SayHello code as follows:
public void SayHello(string helloTo)
{
            using var scope = _tracer.BuildSpan("say-hello").StartActive(true);
            scope.Span.SetTag("hello-to", helloTo);
            var helloString = FormatString(helloTo);
            PrintHello(helloString);
}
Through the above code, we have eliminated those annoying codes.
-`StartActive()` instead of `Start()` to make the span "active" by storing it in thread local storage;
-`StartActive()` returns an `IScope` object instead of an object `ISpan`. IScope is the container of the current active scope. By accessing the activity span `scope.Span`, once the scope is closed, the previous scope will become the current scope, thereby reactivating the previous activity scope in the current thread;
-`IScope` inherits `IDisposable`, which allows us to use `using` syntax;
-`StartActive(true)` tells Scope that once it is processed, it should complete the scope it represents;
-`StartActive()` automatically creates a reference of `ChildOf` to the previous active range, so we don't need to use the builder method of `AsChildOf()` explicitly;
If we run this program, we will see that all three reported spans have the same tracking ID.
Distributed link tracking
Tracking in different processes
Microservices deploy multiple programs separately, and each program provides different functions. In the front, we have learned OpenTracing link tracing. Next, we will split the code, the console program will no longer provide the implementation of the FormatString function, and we will use a Web program to implement the FormatString service.
Create an ASP.NET Core application and select the template with the view model controller in the template.
Add a `FormatController` controller in the Controllers directory, the code is as follows:
using Microsoft.AspNetCore.Mvc;

namespace WebApplication1.Controllers
{
    [Route("api/[controller]")]
    public class FormatController: Controller
    {
        [HttpGet]
        public string Get()
        {
            return "Hello!";
        }

        [HttpGet("{helloTo}", Name = "GetFormat")]
        public string Get(string helloTo)
        {
            var formattedHelloString = $"Hello, {helloTo}!";
            return formattedHelloString;
        }
    }
}
The web application will serve as one of the microservices, and this service has only one API. This API is very simple and provides string formatting. You can also write other APIs to provide services.
Change the CreateHostBuilder of Program and we will fix the port of this service.
        public static IHostBuilder CreateHostBuilder(string[] args) =>
            Host.CreateDefaultBuilder(args)
                .ConfigureWebHostDefaults(webBuilder =>
                {
                    webBuilder.UseUrls("http://*:8081");
                    webBuilder.UseStartup();
                });
Go to `Startup` and delete `app.UseHttpsRedirection();`.
Modify the code of the previous console program and change the `FormatString` method to:
        private string FormatString(string helloTo)
        {
            using (var scope = _tracer.BuildSpan("format-string").StartActive(true))
            {
                using WebClient webClient = new WebClient();
                var url = $"http://localhost:8081/api/format/{helloTo}";
                var helloString = webClient.DownloadString(url);
                scope.Span.Log(new Dictionary
                {
                    [LogFields.Event] = "string.Format",
                    ["value"] = helloString
                });
                return helloString;
            }
        }
After starting the Web program, start the console program.
Console program output:
info: Jaeger.Reporters.LoggingReporter[0]
      Span reported: c587bd888e8f1c19:2e3273568e6e373b:c587bd888e8f1c19:1-format-string
info: ConsoleApp1.Hello[0]
      Hello, This trace!
info: Jaeger.Reporters.LoggingReporter[0]
      Span reported: c587bd888e8f1c19:f0416a0130d58924:c587bd888e8f1c19:1-print-hello
info: Jaeger.Reporters.LoggingReporter[0]
      Span reported: c587bd888e8f1c19:c587bd888e8f1c19:0000000000000000:1-say-hello
Next, we can change Formating to:
        private string FormatString(string helloTo)
        {
            using (var scope = _tracer.BuildSpan("format-string").StartActive(true))
            {
                using WebClient webClient = new WebClient();
                var url = $"http://localhost:8081/api/format/{helloTo}";
                var helloString = webClient.DownloadString(url);
                var span = scope.Span
                    .SetTag(Tags.SpanKind, Tags.SpanKindClient)
                    .SetTag(Tags.HttpMethod, "GET")
                    .SetTag(Tags.HttpUrl, url);

                var dictionary = new Dictionary();
                _tracer.Inject(span.Context, BuiltinFormats.HttpHeaders, new TextMapInjectAdapter(dictionary));
                foreach (var entry in dictionary)
                    webClient.Headers.Add(entry.Key, entry.Value);
                return helloString;
            }
        }
`SetTag` can set a tag, we set a tag for the Span requesting to the Web this time, and store the requested URL.
                var span = scope.Span
                    .SetTag(Tags.SpanKind, Tags.SpanKindClient)
                    .SetTag(Tags.HttpMethod, "GET")
                    .SetTag(Tags.HttpUrl, url);
Inject context information through `Inject`.
_tracer.Inject(span.Context, BuiltinFormats.HttpHeaders, new TextMapInjectAdapter(dictionary));These configuration specifications can be found at https://github.com/opentracing/specification/blob/master/semantic_conventions.md.
Tracking in ASP.NET Core
In the above, we have implemented the tracking of Client in different processes, but have not yet implemented tracking in Server. We can modify the code in Startup.cs and replace the following code:
using Jaeger;
using Jaeger.Samplers;
using Microsoft.AspNetCore.Builder;
using Microsoft.Extensions.Configuration;
using Microsoft.Extensions.DependencyInjection;
using Microsoft.Extensions.Logging;
using OpenTracing.Util;
using System;

namespace WebApplication1
{
    public class Startup
    {
        private static readonly ILoggerFactory loggerFactory = LoggerFactory.Create(builder => builder.AddConsole());
        private static readonly Lazy Tracer = new Lazy(() =>
        {
            return InitTracer("webService", loggerFactory);
        });
        private static Tracer InitTracer(string serviceName, ILoggerFactory loggerFactory)
        {
            var samplerConfiguration = new Configuration.SamplerConfiguration(loggerFactory)
                .WithType(ConstSampler.Type)
                .WithParam(1);

            var reporterConfiguration = new Configuration.ReporterConfiguration(loggerFactory)
                .WithLogSpans(true);

            return (Tracer)new Configuration(serviceName, loggerFactory)
                .WithSampler(samplerConfiguration)
                .WithReporter(reporterConfiguration)
                .GetTracer();
        }
        public Startup(IConfiguration configuration)
        {
            Configuration = configuration;
        }

        public IConfiguration Configuration {get;}

        // This method gets called by the runtime. Use this method to add services to the container.
        public void ConfigureServices(IServiceCollection services)
        {
            services.AddMvc();

            GlobalTracer.Register(Tracer.Value);
            services.AddOpenTracing();
        }

        // This method gets called by the runtime. Use this method to configure the HTTP request pipeline.
        public void Configure(IApplicationBuilder app)
        {
            app.UseRouting();
            app.UseEndpoints(endpoints =>
            {
                endpoints.MapControllerRoute(
                    name: "default",
                    pattern: "{controller=Home}/{action=Index}/{id?}");
            });
        }
    }
}
In this way, different processes can be tracked.
OpenTracing API and Jaeger
OpenTracing is an open distributed tracing specification. The OpenTracing API is a consistent, expressible, vendor-independent API for distributed tracing and context propagation.
Jaeger is Uber's open source distributed tracking system.
OpenTracing's client library and specifications can be viewed in Github: https://github.com/opentracing/
Detailed introduction can be consulted by yourself.
Here we need to deploy a Jaeger instance for microservices and transaction tracking learning needs.
Deploying with Docker is very simple, just execute the following command:
docker run -d -p 5775:5775/udp -p 16686:16686 -p 14250:14250 -p 14268:14268 jaegertracing/all-in-one:latestVisit the 16686 port, you can see the UI interface.
Jaeger's port functions are as follows:
Collector
14250 tcp gRPC sends proto format data
14268 http directly accept client data
14269 http health check
Query
16686 http jaeger UI front end
16687 http health check
Next we will learn how to upload data to Jaeger through code.
Link tracking practice
Note that when data is uploaded to Jaeger, Span is uploaded, and the log content will not be uploaded.
Continue to use the above console program, add the `Jaeger.Senders.Grpc` package to Nuget.
We can upload data to Jaeger through UDP (port 6831) and gRPC (14250), here we use gRPC.
Modify the `InitTracer` method of the console program, the code is as follows:
private static Tracer InitTracer(string serviceName, ILoggerFactory loggerFactory)
{
Configuration.SenderConfiguration.DefaultSenderResolver = new SenderResolver(loggerFactory)
.RegisterSenderFactory();
var reporter = new RemoteReporter.Builder()
.WithLoggerFactory(loggerFactory)
.WithSender(new GrpcSender("180.102.130.181:14250", null, 0))
.Build();
var tracer = new Tracer.Builder(serviceName)
.WithLoggerFactory(loggerFactory)
.WithSampler(new ConstSampler(true))
.WithReporter(reporter);
return tracer.Build();
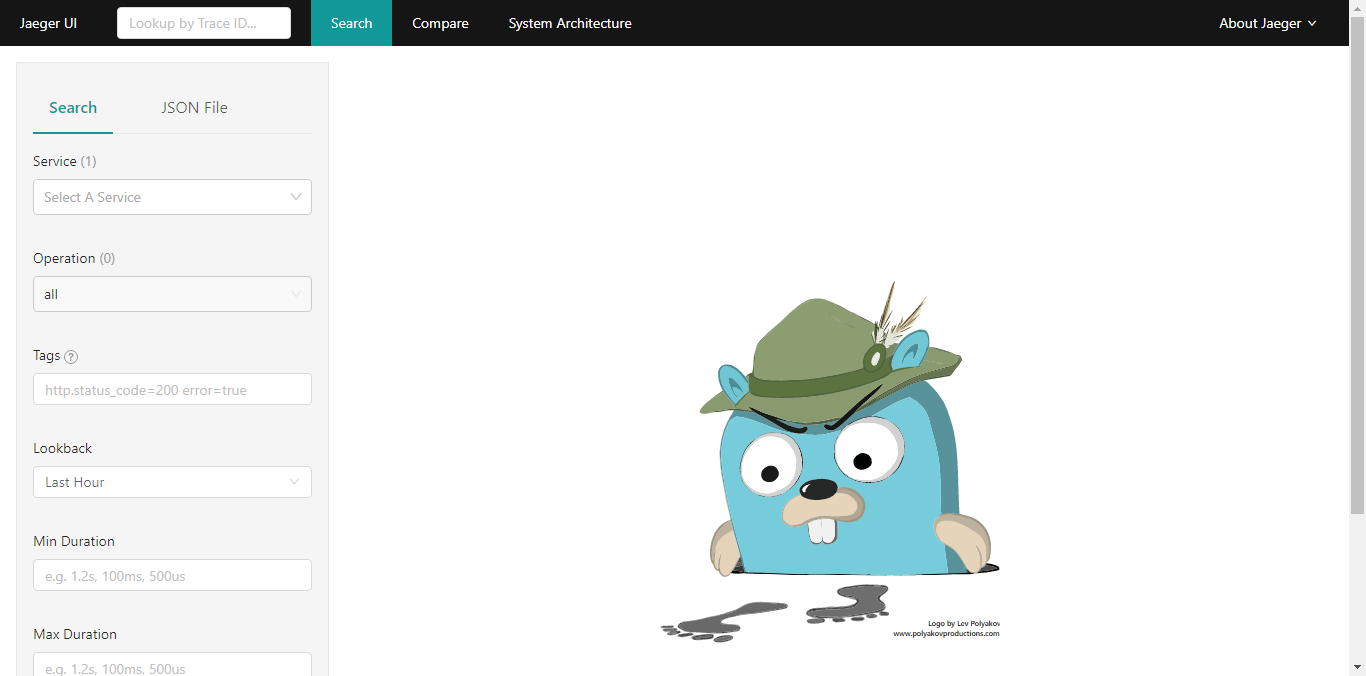
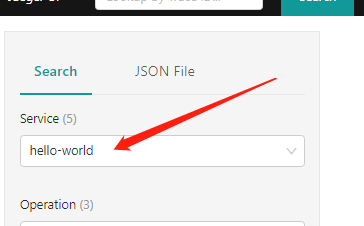
} Start the Web and console programs respectively, then open the Jaeger interface, select hello-world in the "Service", and then click the bottom Find Traces.
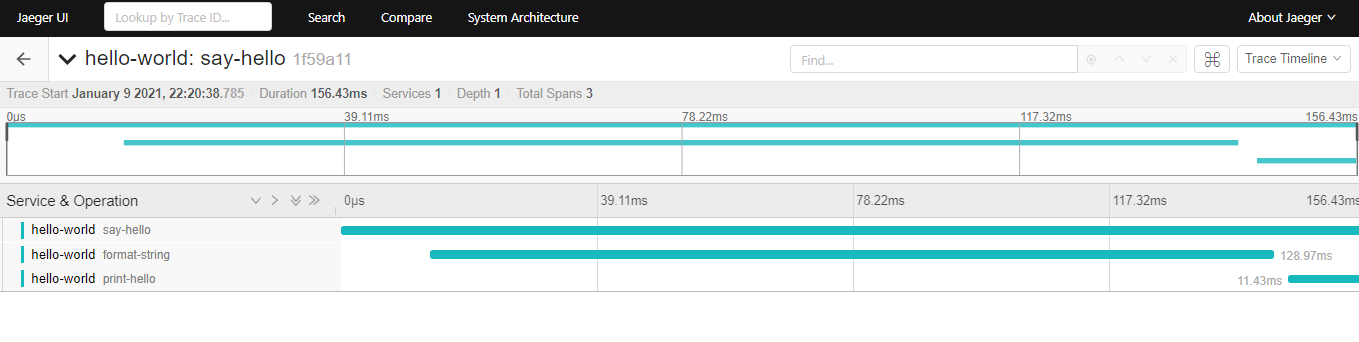
Through Jaeger, we can analyze the execution speed of functions in the link and server performance.

文章评论